. 2021 Jun 17;62(7):650–659. doi: 10.3349/ymj.2021.62.7.650

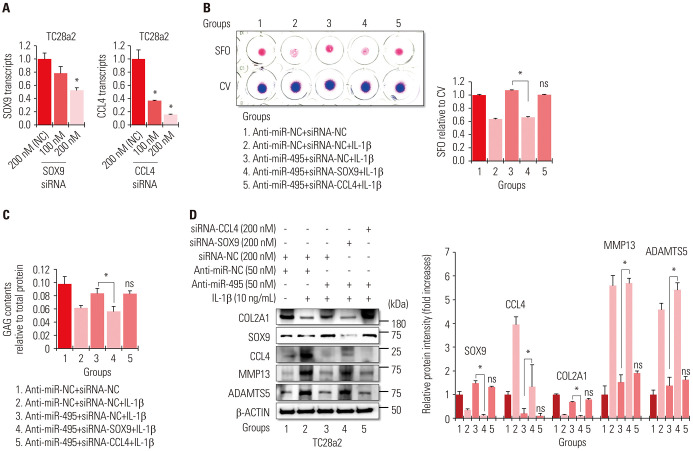
Fig. 4. miRNA-495–SOX9 axis is more important than miRNA-495–CCL4 axis in protecting chondrocytes against IL-1β-mediated inflammation. (A) The graphs represent the results of quantitative real-time polymerase chain reaction (qRT-PCR) using RNA extracted from TC28a2 cells transfected with negative control (NC) siRNA (200 nM), SOX9 siRNA (100 or 200 nM), or CCL4 siRNA (100 or 200 nM) (n=3 experimental replicates) to validate the efficiency of the siRNAs used in this study. The expression levels of SOX9 and CCL4 mRNAs were normalized to those of 18S rRNA. The data are presented as means±SD. *p<0.05 compared to the 200 nM of NC siRNA groups. (B) Anti-miR-NC- or anti-miR-495-transfected TC28a2 cells were co-transfected with NC siRNA, SOX9 siRNA, or CCL4 siRNA, and then the cells were seeded at 1×10⁵ cells per well in 24-well culture plates. The cells were treated with 10 ng/mL of IL-1β or with no IL-1β as a control. Safranin O staining was performed to detect glycosaminoglycans (GAGs). Stained cells were destained with 10% cetylpyridinium for quantitative analysis. Absorbance was measured at 490 nm. *p<0.05 for comparison between two groups (n=3 experimental replicates). (C) GAG content was measured using the Blyscan sulfate GAG assay. The sulfated GAGs were quantified in the supernatant and standardized using the chondroitin 4-sulfate standard solution. *p<0.05 compared to group 1 or 3 (n=3 experimental replicates). (D) Protein levels of SOX9, COL2A1, COX-2, ADAMTS5, and MMP13 were analyzed in the cells using Western blotting. The graphs represent the average value of the band intensity for each blot, and each blot was normalized to the band intensity value of β-actin. The data are presented as means±SD. *p<0.05 vs. Group 3 (n=3 experimental replicates). IL-1β, interleukin-1β; SFO, safranin O; CV, crystal violet.

Fig. 4