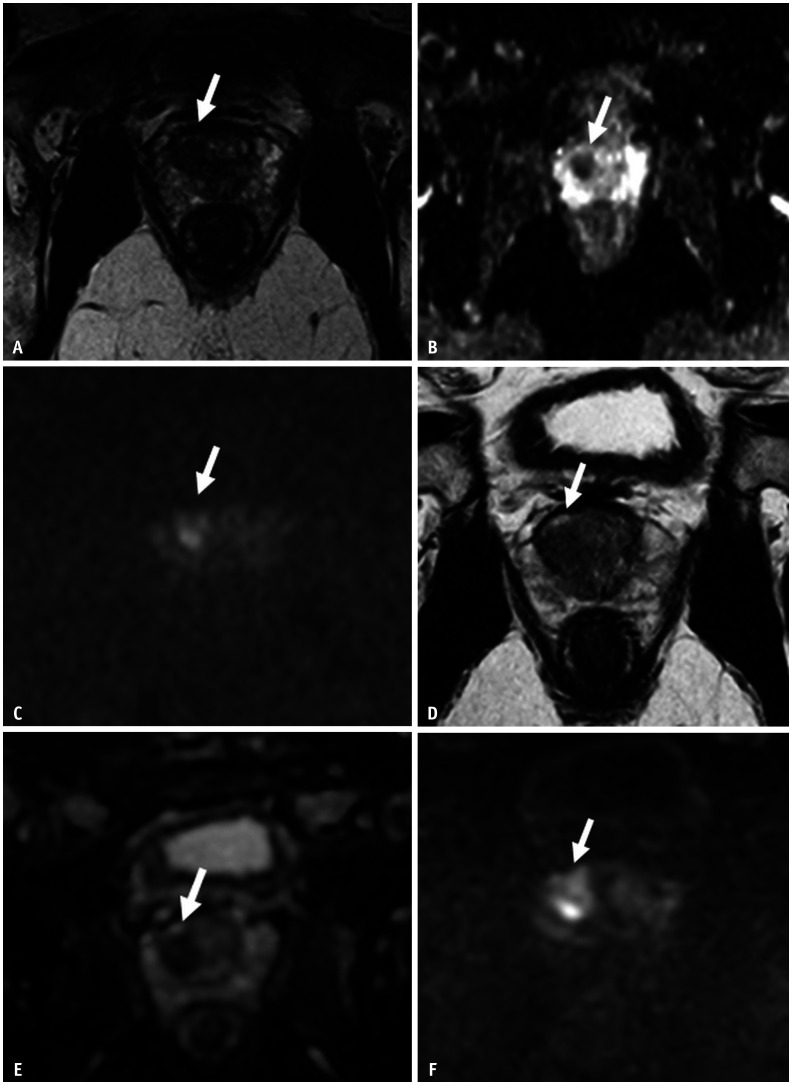
Fig. 3. A 66-year-old male presented with an elevated serum PSA of 6.2 ng/mL.
mpMRI was performed as a first-line investigation.
A. T2-weighted imaging shows a circumscribed hypointense lesion in the transition zone at the right midgland (arrow). B. ADC map shows a moderate low signal (arrow). C. DWI shows moderate hyperintensity (arrow). This was graded as a PI-RADS 3 lesion. Both systematic and targeted biopsies were performed, which showed only a Gleason 3 + 3 cancer. The patient was deemed eligible for AS. Follow-up mpMRI was performed 1 year after baseline mpMRI before the confirmatory biopsy. Serum PSA had increased to 10.5 mg/mL. D. T2-weighted imaging shows a slight increase in the size of the hypointense lesion in the transition zone at the right midgland, now also appearing more obscured (arrow). E. ADC map shows a moderate low signal (arrow). F. However, the lesion appeared more hyperintense on DWI (arrow). The lesion was graded as PI-RADS 3, similar to baseline mpMRI. However, this was assigned a Prostate Cancer Radiological Estimation of Change in Sequential Evaluation score of 4 because of the increased lesion size, suggesting a high probability of radiologic progression. Both systematic and targeted biopsies were repeated. MRI-ultrasound fusion targeted biopsy showed a Gleason 3 + 4 cancer. The patient was taken off AS. ADC = apparent diffusion coefficient, AS = active surveillance, DWI = diffusion-weighted imaging, mpMRI = multiparametric MRI, PI-RADS = Prostate Imaging-Reporting and Data System, PSA = prostate-specific antigen

