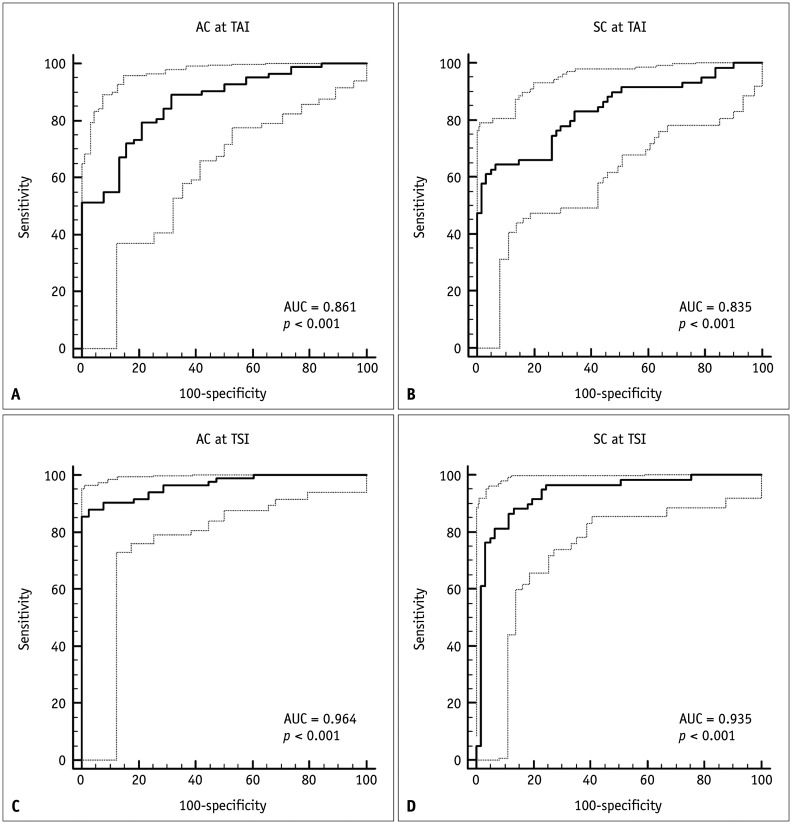
Fig. 4. The diagnostic performances of AC at TAI (A, C) and SC at TSI (B, D) for the detection of hepatic steatosis (MRI-PDFF ≥ 5%; A, B) and the detection of hepatic fat contents of ≥ 10% (MRI-PDFF ≥ 10%; C, D).
AC = attenuation coefficient, AUC = area under the receiver operating characteristic curve, MRI-PDFF = magnetic resonance imaging proton density fat fraction, SC = scatter-distribution coefficient, TAI = tissue attenuation imaging, TSI = tissue scatter-distribution imaging

