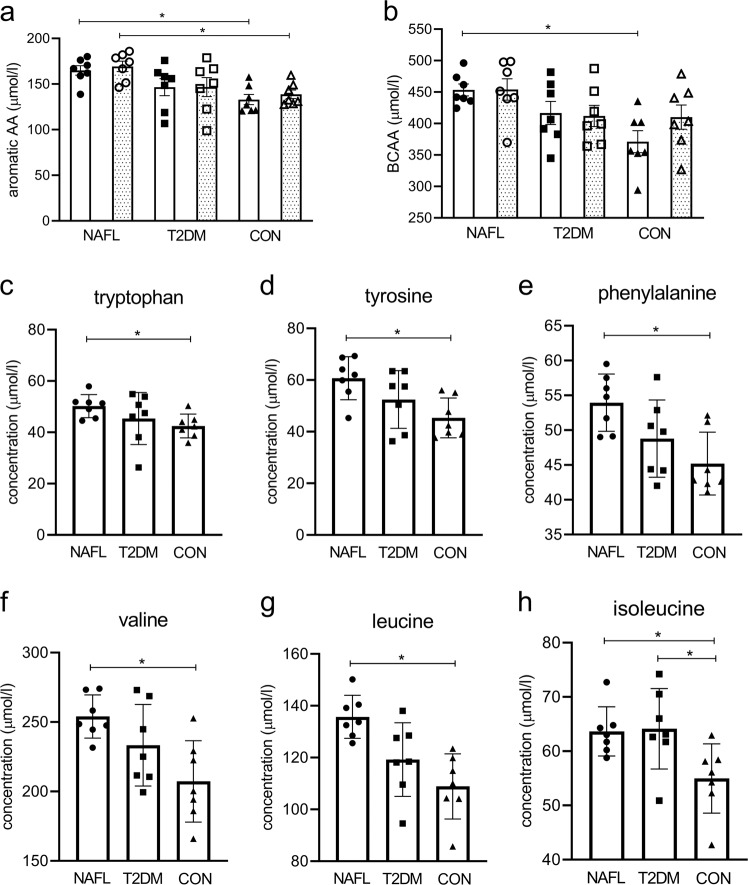
Fig. 2. Changes in fasting total AAA and total BCAA levels after exercise training.
Fasting total AAA (including phenylalanine, tryptophan, and tyrosine) (a) and total BCAA (including leucine, isoleucine, and valine) (b) measured in plasma before (open bars) and after (dotted bars) the exercise program. Pre-exercise fasting plasma levels of tryptophan (c), tyrosine (d), phenylalanine (e), valine (f), leucine (g) and isoleucine (h). People with NAFL (dots, n = 7), patients with T2DM (squares, n = 7), and in CON (triangles, n = 7). Data are expressed as mean ± SEM and tested using Anova for repeated measurements; *p < 0.05.

