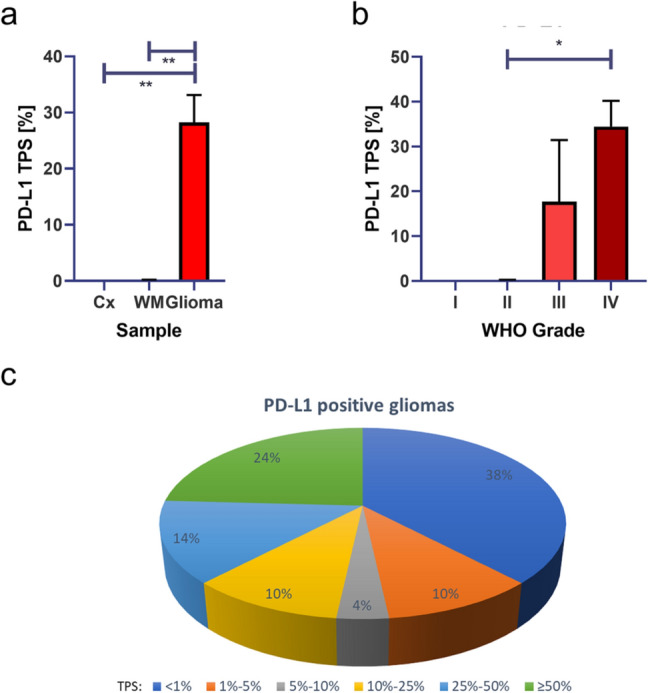
Fig. 2.

Statistical analysis of PD-L1 expression. Statistical analysis of PD-L1 expression showed significant overexpression of PD-L1 in glioma compared with healthy cortex (a) and white matter (b). Analysis of WHO grade I, II, III and IV glioma showed significant overexpression in high grade glioblastoma compared with low grade diffuse glioma. Analysis of individual TPS showed PD-L1 expression in glioma showed TPS of ≥ 50% in 27% of gliomas, TPS of 25–50% in 12% of gliomas, TPS of 10–25% in 10% of gliomas, TPS of 5–10% in 2% of gliomas, TPS of 1–5% in 9% of gliomas, and TPS of < 1% in 40% of gliomas (c). a, b Indicated are mean and SEM. *p < 0.05, **p < 0.01
