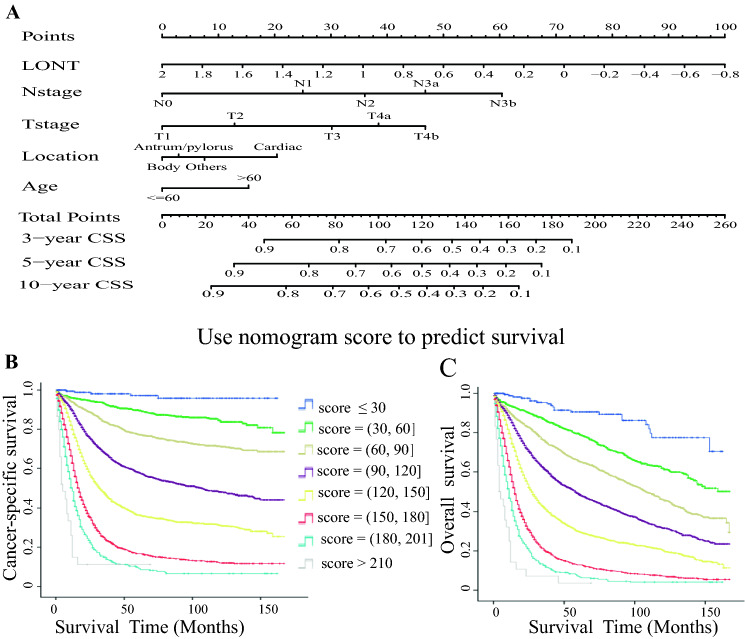
Fig. 2.
The nomogram and Kaplan–Meier survival plot based on the risk score. a The nomogram was applied by adding up the points identified on the points scale for each variable. The sum of these points projected on the bottom scales estimates the probability of 3-, 5- and 10-year CSS. b Kaplan–Meier survival analyses for cancer-specific survival based on nomogram scores. c Kaplan–Meier survival analyses for overall survival based on nomogram scores

