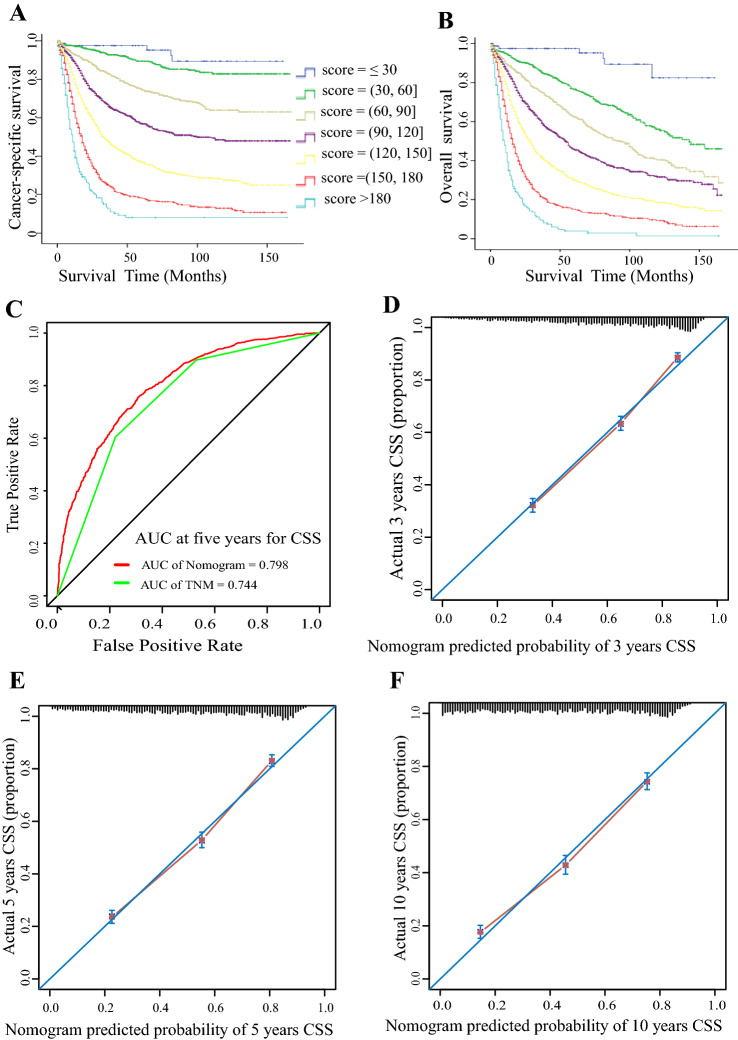
Fig. 3.
Performance of the prognostic nomogram model in the validation cohort. a Kaplan–Meier survival analyses for cancer-specific survival based on nomogram scores, which were calculated according to the nomogram in Fig. 2a. b Kaplan–Meier survival analyses for overall survival based on nomogram scores. c The area under the time-dependent ROC curve was calculated for the 8th TNM staging system and the nomogram at five years for cancer-specific survival. Red: the nomogram established in the present study; green: the 8th TNM staging system. The calibration curves for predicting patient CSS at 3 years (d), 5 years (e) and 10 years (f). The nomogram model predicting CSS is plotted on the x-axis, and the actual survival proportion is shown on the y-axis

