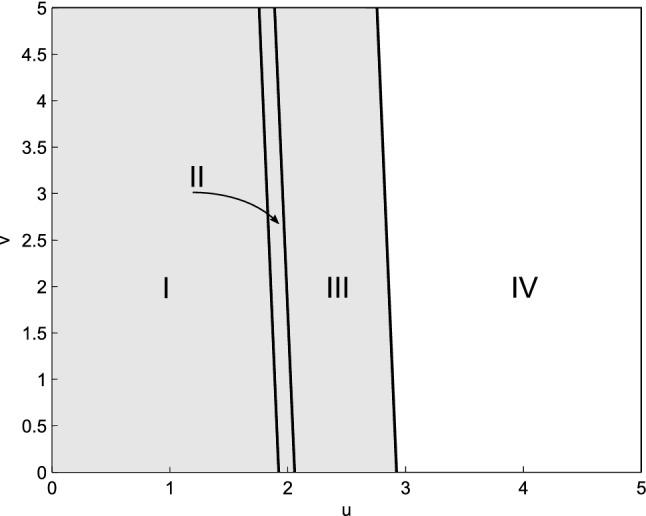
Fig. 13.

Bifurcation diagram for system (1). The gray area indicates the range of parameters for which the positive stationary state exists (regions I, II, and III), while for parameters from region IV, it does not exist. The steady state is locally stable in regions I and II, whereas in region III, it is unstable. Region I depicts the range of parameters for which the sufficient condition holds. Here, , while the values of the remaining parameters are listed in Table 1
