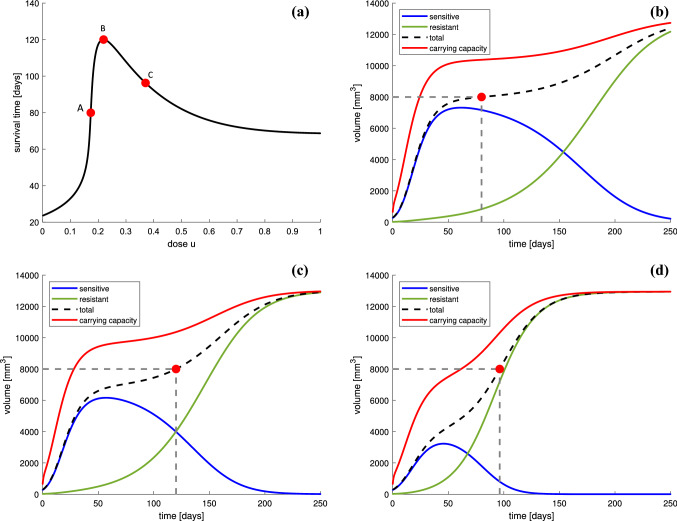
Fig. 3.
a Survival times for different chemotherapy doses in our model. Red point B depicts the maximum survival time; here, days correspond to . Points A and C are chosen to represent different behaviors of the tumor cells population for ( days) and ( days), respectively. b–d Evolution of the volumes of sensitive and resistant subpopulations, carrying capacity and total volume of the tumor for three different values of chemotherapy u corresponding to the points A, B, and C in a. The dotted lines mark the point at which the tumor volume reaches the critical level . The initial condition is chosen as [280, 20, 650]

