Fig. 5.

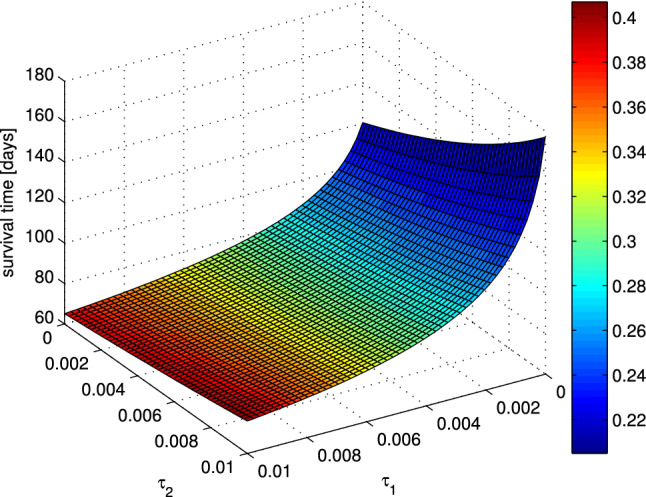
Dependence of the maximum survival time on the mutation rates . Color represents the chemotherapy dose which yields the maximum survival time. The initial condition is chosen as [280, 20, 650] and the anti-angiogenic agent dose as

Dependence of the maximum survival time on the mutation rates . Color represents the chemotherapy dose which yields the maximum survival time. The initial condition is chosen as [280, 20, 650] and the anti-angiogenic agent dose as