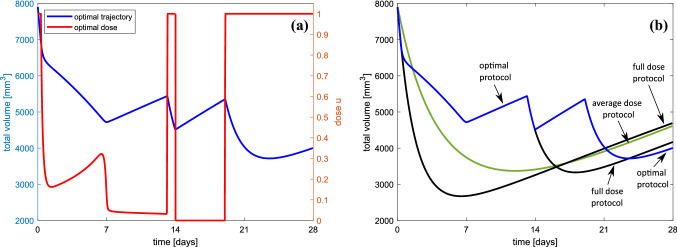
Fig. 6.
a Optimal protocol for 28-day treatment consisting of two 14-day therapy windows. Blue curve represents trajectory for optimal protocol penalizing drug resistance in both 14-day treatment windows. Red curve reflects the corresponding optimal dosage. b A comparison of the optimal trajectory (blue) with trajectories for MTD protocol (black), mean dose, which is equal to the average dose for the optimal control (green) and trajectory corresponding to 14-day optimization against drug resistance and 14-day MTD protocol (blue–black). For each protocol, initial condition is , just below critical volume

