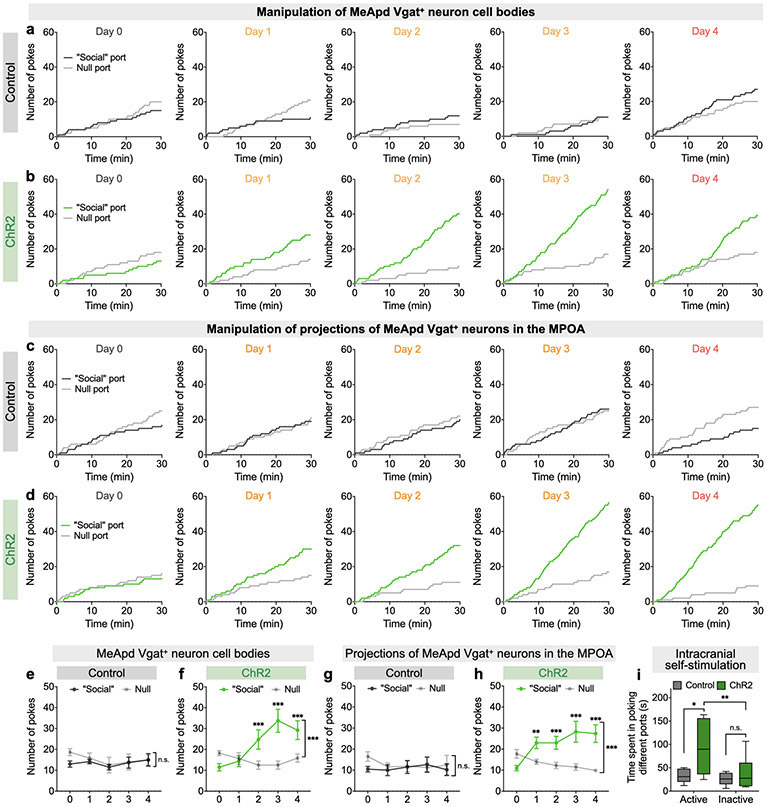
Extended Data Fig. 7. Optogenetic activation of MeApd Vgat+ neurons or MeApd-to-MPOA projections drives reinforcement.
a-d, Cumulative distribution of the numbers of nose pokes to the optogenetic “social” port or the null port in a modified social operant task. Representative data from a control or ChR2 animal (a, b, MeApd cell bodies; c, d, MeApd-to-MPOA projections) on each day. e-h, Numbers of pokes to the optogenetic “social” port or the null port on each day. For MeApd cell bodies, control (e) and ChR2-expressing (f) animals; for MeApd-to-MPOA projections, control (g) and ChR2-expressing (h) animals. Two-way repeated measures ANOVA with Bonferroni post-hoc correction (**P < 0.01, ***P < 0.001). i, Activation of MeApd-to-MPOA projections in ChR2-expressing animals spend greater time in the active port (total time spent in the port), whereas control animals do not. Two-way repeated measures ANOVA with Bonferroni post-hoc correction ((*P < 0.05, **P < 0.01). (e, f), n = 6 mice (control) and n = 8 mice (ChR2); (g, h), n = 8 mice (control) and n = 8 mice (0ChR2); (i), n = 5 mice (control) and 7 mice (ChR2). (e-h), mean ± SEM; (i), boxplots: center = median, box = quartiles, whisker = 10–90 percentile. For detailed statistics information, see Supplementary Table 1.

