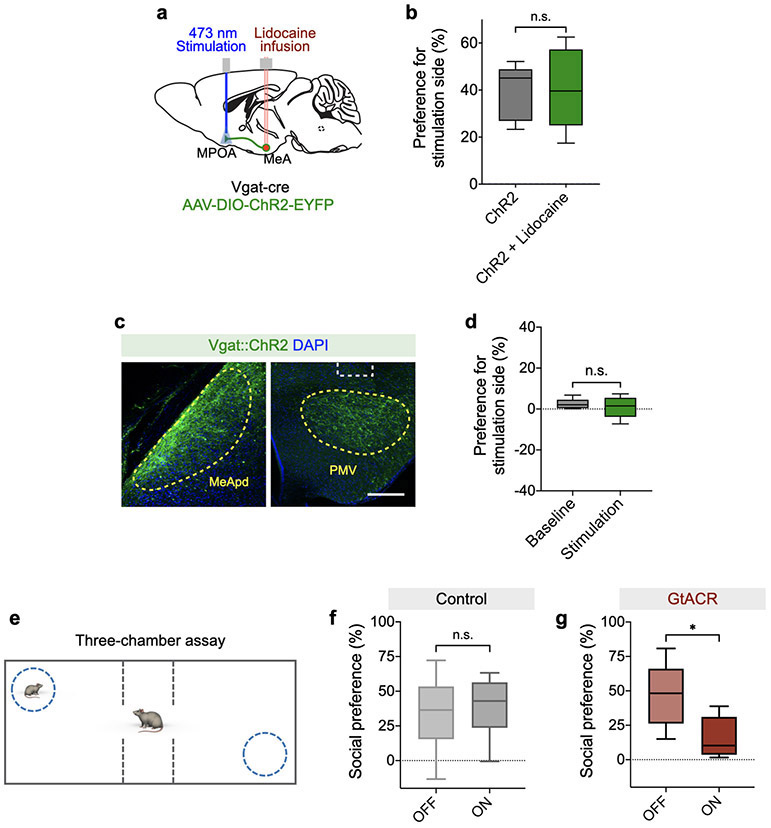
Extended Data Fig. 9. Behavioral functions of MeA-to-MPOA and MeA-to-PMV pathways.
a, Schematic showing optogenetic stimulation of MeApd axon terminals in the MPOA and lidocaine infusion in the MeApd cell bodies. b, Local infusion of lidocaine in the MeApd does not affect the behavioral effect of stimulating the MeApd-to-MPOA projection. P = 0.7612, paired t test (two-sided). c-d, Activating the MeApd-to-PMV projection does not promote positive reinforcement. c, Example images showing expression of ChR2 in the MeApd Vgat+ neurons (left) and fiber placement above their axon terminals in the PMV (right). Scale bar = 200 μm. d, Optogenetic stimulation of MeApd Vgat+ neuron terminals in the PMV does not produce positive place preference in a real-time place preference assay. P = 0.5103, paired t test (two-sided). e-g. Suppressing MeApd Vgat+ neuron activity reduces social preference in a three-chamber assay. e, Schematic showing the three-chamber assay. f-g, Optogenetic inhibition of MPOA-projecting MeA neurons in GtACR-expressing mice (g), but not in control mice (f), reduces social preference in a three-chamber social preference assay. P = 0.7183 (f), *P = 0.0471 (g), paired t test (two-sided). (b), n = 5 ChR2-expressing mice; (c, d), n = 6 ChR2-expressing mice; (f-g), n = 6 control mice and 5 GtACR-expressing mice. Boxplots: center = median, box = quartiles, whisker = 10–90 percentile. For detailed statistics information, see Supplementary Table 1.

