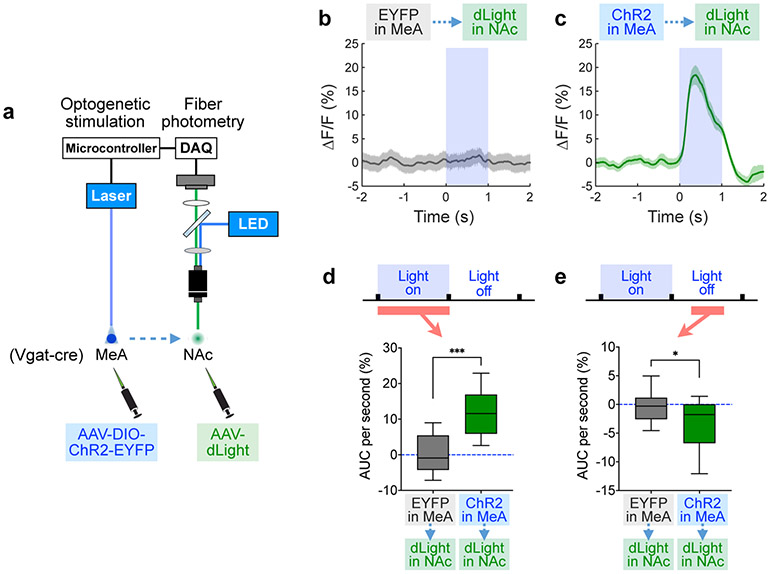
Figure 5. Activating MeApd Vgat+ neurons triggers dopamine release in the NAc.
a, Schematic showing fiber photometry for measuring dopamine signals in the NAc using dLight fluorescence while optogenetically activating MeApd Vgat+ neurons. b, c, dLight fluorescence changes in the NAc in response to 1-s optogenetic stimulation of the MeApd in EYFP (b) or ChR2-expressing (c) mice. d, AUC per second during optogenetic stimulations (0-1 s from the onset). ***P < 0.001, Mann-Whitney test (two-sided). e, AUC per second after optogenetic stimulations (0.3-0.6 s from the offset). *P = 0.0125, Mann-Whitney test (two-sided). In (b-e), n = 56 trials for controls from 6 mice and n = 39 trials for ChR2 from 4 mice. (b, c) mean ± SEM; (d, e) boxplots: center = median, box = quartiles, whisker = 10–90 percentile. For detailed statistics information, see Supplementary Table 1.

