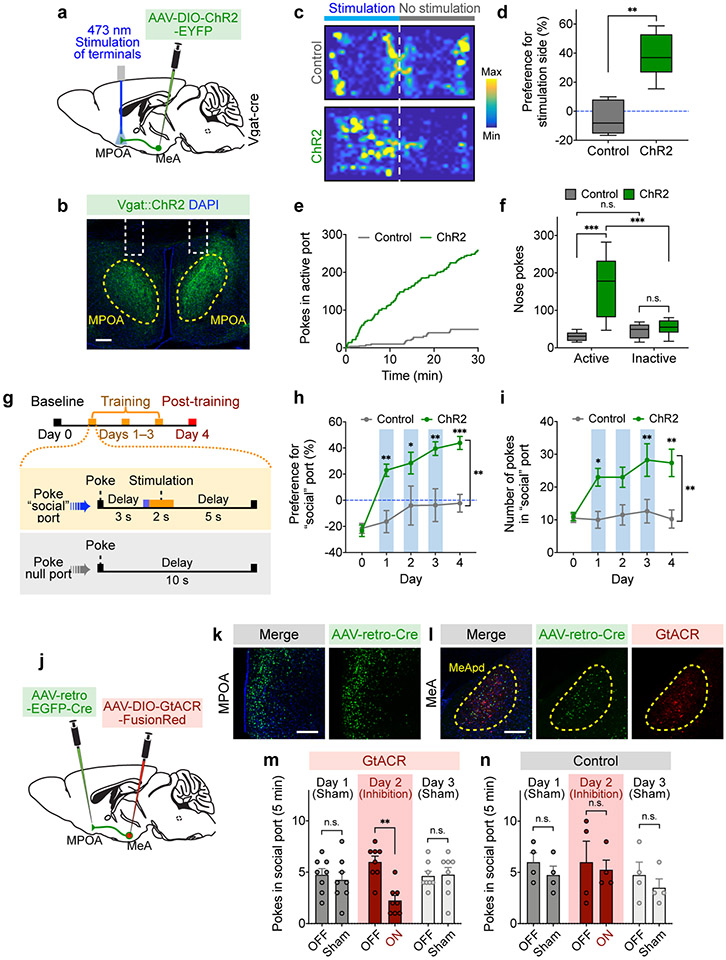
Figure 6. The MPOA-projecting MeApd circuit mediates social reward.
a, Schematic showing viral injection and fiber placement for optogenetic activation of axonal terminals of MeApd Vgat+ neurons in the MPOA. b, Example image showing projections of MeApd Vgat+ neurons in the MPOA. Scale bar = 200 μm. c, Representative heatmaps showing locomotion trajectories of control and ChR2-experessing mice in the RTPP test. d, ChR2-expressing animals with axonal terminals stimulated display a positive preference for stimulation-coupled chamber compared to EYFP controls. **P < 0.0025, Mann-Whitney test (two-sided). e, Cumulative distribution of the number of nose-pokes in the active port by a representative ChR2-expressing or control animal during the self-stimulation assay. f, ChR2-expressing animals with axonal terminals stimulated exhibit greater number of pokes in the active port, whereas control animals do not. Two-way repeated measures ANOVA with Bonferroni post-hoc correction (***P <0.001). g, Schematic showing a modified social operant task, where presentation of target animals is replaced with 2-s optogenetic stimulation of Vgat+ neuron terminals in the MPOA. Similar to Fig. 3i, poking the optogenetic “social” port leads to a 3-s delay followed by a 2-s stimulation. The 5-day experiment consists of 1 day of a baseline session, 3 days of training sessions, and 1 day of a post-training session. h, i, ChR2-expressing animals develop a strong preference (h) for and increased nose-pokes (i) in the optogenetic “social” port over 3 days of training, whereas control animals do not. Two-way repeated measures ANOVA with Bonferroni post-hoc correction (*P < 0.05, ** P < 0.01, ***P < 0.001). j, Schematic showing viral injection and fiber placement for optogenetic inhibition of MPOA-projecting MeApd neurons. k, l, Example image showing the expression of AAV-retro-EGFP-Cre in the MPOA (k) and GtACR in the MPOA-projecting MeApd neurons (l). Blue: DAPI; green, EGFP; red, GtACR-FusionRed. Scale bar = 200 μm. m, n, Optogenetic inhibition of neural activity in GtACR-expressing (m) but not control (n) mice reduces pokes in social port in the social operant task (see methods). After animals established a positive preference for social port, sham inhibition was performed on days 1 and 3, while optogenetic inhibition was performed on day 2. Two-way repeated measures ANOVA with Bonferroni post-hoc correction (**P < 0.01). Silencing MPOA-projecting MeApd neurons also reduces social preference in the three-chamber assay (Extended Data Fig. 9e-g). In (c, d), n = 7 mice (ChR2) and 5 mice (control); in (e, f), n = 7 mice (ChR2) and 5 mice (control); in (h, i), n = 8 mice (ChR2) and 8 mice (control); in (m, n), n = 8 mice (GtACR) and 4 mice (control). (d, f) boxplots: center = median, box = quartiles, whisker = 10–90 percentile; (h, i, m, n) mean ± SEM. For detailed statistics information, see Supplementary Table 1.

