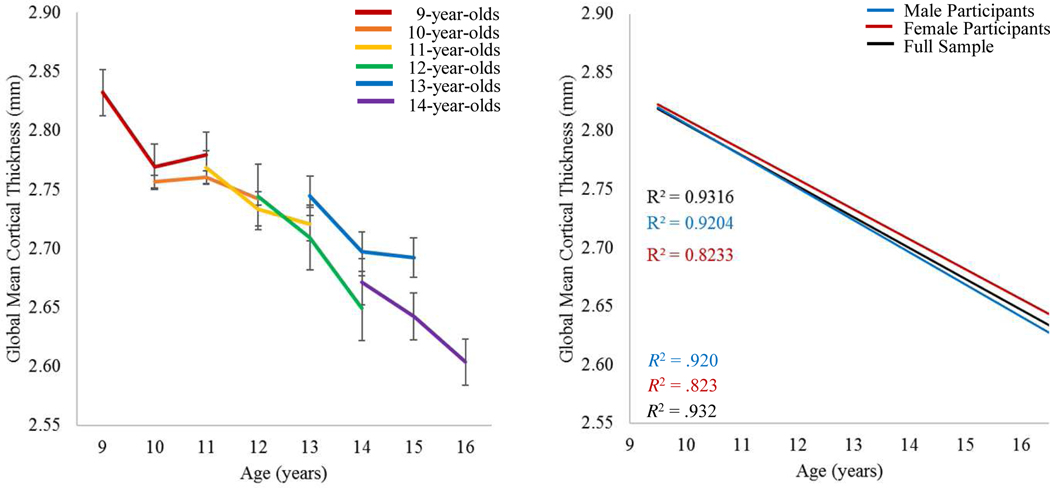
Figure 1. Trajectories of Change in Global Mean Cortical Thickness.
Note: (Left) Average cortical thickness measures over time, plotted separately for children starting the study at different ages. Participants who were 14-years-old and older were collapsed into a single age bin for this figure because, by design, there were relatively few youth who were over 14 at the start of the study. (Right) Lines of best fit demonstrating the trajectory of cortical thinning throughout adolescence for the full sample, and separately for male versus female participants. The R2 for each line is shown on the graphs. There were relatively few youth over the age of 16 at the final time point of the study; thus, data from youth 16 and older were collapsed across the 16-year-old age bin to avoid biasing the regression.

