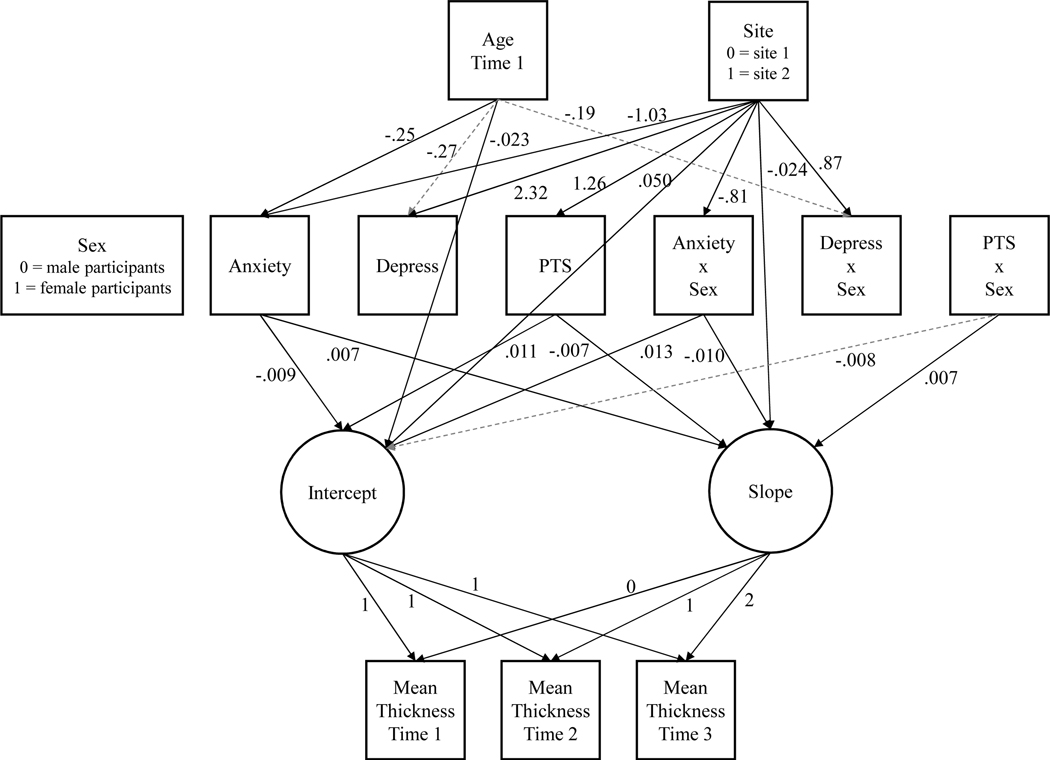
Figure 2. Latent Growth Curve Model Results.
Note: Results of the final model, in which age at time 1, study site, sex, psychological symptoms, and their interactions with sex predict the latent intercept and slope of change in global mean cortical thickness. Solid lines indicate statistically significant estimates at the p < .05 level, while dashed gray lines indicate non-significant, but trending (p < .10) relationships. For simplicity and visibility, relationships that were non-significant at the p > .10 level, and correlations among variables (not of interest) are not shown on the figure. All estimates are unstandardized. “Anxiety” = anxiety symptoms; “Depress” = depressive symptoms; “PTS” = posttraumatic stress symptoms; “…x Sex” = interaction terms; Dummy coding schemes for categorical variables are shown in the figure with the respective variable.

