
FIG. 1.
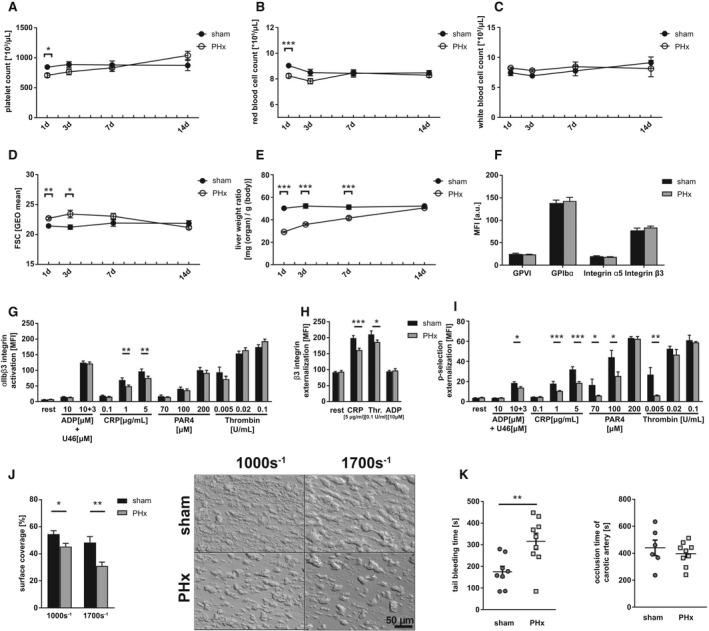
Reduced total blood cell count and platelet activation defects in thrombosis and hemostasis 1 day after PHx. (A) Platelet count, (B) RBC count, and (C) WBC count of C57Bl6/J mice undergoing PHx. Sham operation served as control (n = 1 day: 22 sham, 30 PHx; 3 days: 22 sham, 26 PHx; 7 days: 16 sham, 20 PHx; 14 days: 8 sham, 12 PHx). (D) Platelet size of PHx and sham animals measured by flow cytometry using the geometrical mean of GPIb‐positive platelets. (n = 1 day: 10 sham, 14 PHx; 3/7/14 days: 6 sham, 8 PHx). (E) Calculated liver weight ratio (n = 5 sham, 8 PHx). (F) Expression of indicated glycoproteins on the surface of platelets measured by mean fluorescence intensity (MFI) in flow cytometric analysis (n = 11 sham + 18 PHx). (G) Activation of ⍺IIbβ3 integrin on the platelet surface with indicated agonists (n = 6 sham, 9 PHx). (H) Externalization of the β3 integrin subunit upon platelet stimulation (n = 6 sham, 8 PHx). (I) Externalization of P‐selectin on the platelet surface with indicated agonists (n = 6 sham, 9 PHx). (J) Thrombus formation on a collagen matrix under arterial shear rates with representative pictures (1.000 s−1: n = 6 sham, 5 PHx; 1.700 s−1: n = 5 sham, 9 PHx). (K) In vivo analysis of hemostatic dysfunction by tail bleeding time (n = 8 sham, 9 PHx) and the Fe3Cl‐induced injury of the carotid artery (n = 6 sham, 9 PHx). Depicted are mean values + SEM; *P < 0.05; **P < 0.01; ***P < 0.001, using a paired Student t test. Abbreviations: FSC, forward scatter; GEO, geometric; GPVI, glycoprotein VI.