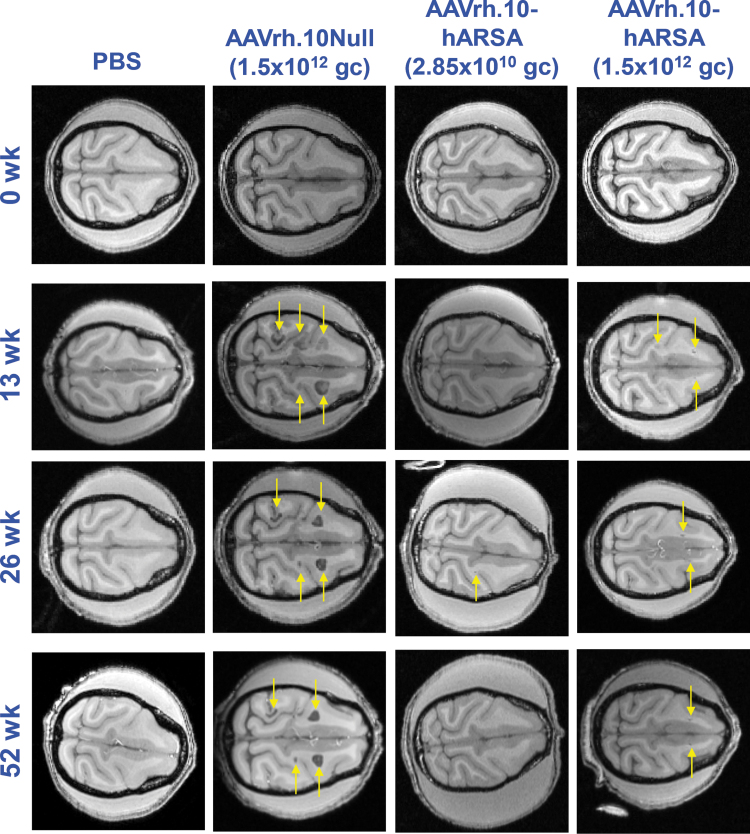
Figure 3.
CNS MRI assessment following CNS administration of AAVrh.10hARSA to NHPs. NHP in the long-term studies (52 weeks, n = 6; 4 female/2 male) were analyzed by T1 weighted MRI scans at 0, 13, 26, and 52 weeks after intraparenchymal administration of the AAVrh.10hARSA vector (2.85 × 10¹⁰ gc, 2.4 × 10⁹ gc/site or 1.5 × 10¹² gc, 1.3 × 10¹¹ gc/site) or the AAVrh.10Null vector (1.5 × 10¹² gc) or PBS. Times for assessment were ±6 days. Shown are axial slices (0.5 mm thick) of the head from the same NHP at specific time points. The depth of the axial slice displayed is 1.0 cm from superior aspect of brain; the same sections were matched between animals for the image scans. The first column (far-left) contains images from PBS group NHP (female); second column (left), AAVrh.10Null-treated NHP (female); third column (right), low dose AAVrh.10hARSA-treated NHP (male); and fourth column (far-right), high dose AAVrh.10hARSA-treated NHP (female). The rows contain images for each assessment time point (0, 13, 26, and 52 weeks). Orientation of the MRI scans of the NHP heads is posterior (left) to anterior (right), with the longitudinal fissure, horizontal in the panels. The yellow arrows denote ROIs, including pathologic findings in the T1 scans. These findings were confirmed on T2 and T2-FLAIR scans (not shown) during the same imaging session. CNS, central nervous system; MRI, magnetic resonance imaging; ROIs, regions of interest.

