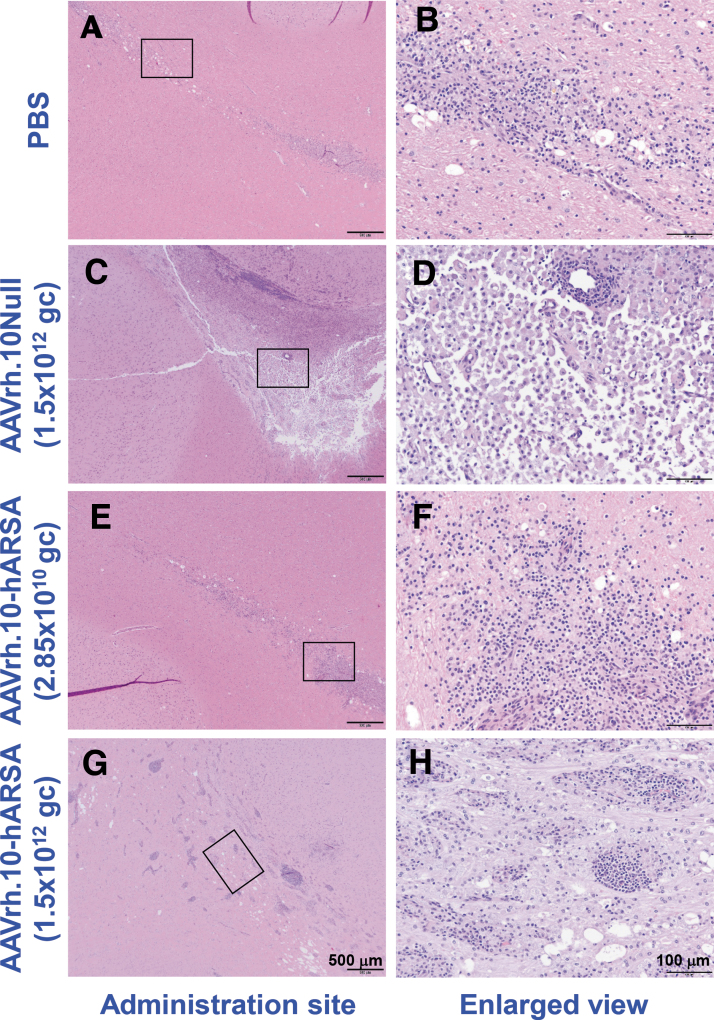
Figure 4.
Histopathology assessment of the localized vector administration sites of AAVrh.10hARSA, AAVrh.10Null, and PBS in CNS. Shown is the histopathology of the brain coronal sections following necropsy of 1, 13, and 26 weeks NHP of the localized T1 MRI pathologic findings at the catheter sites. The coronal sections were stained with H&E. Examples of the findings are shown, with enlarged areas (black boxes in left panels) shown in the right column. The resulting brain pathology staining is shown for the PBS (male, 1 week, CNS site B; A, B), AAVrh.10Null (female, 13 weeks, CNS site A; C, D), low dose (male, 1 week, CNS site B; E, F), and high dose (female, 26 weeks, CNS site A; G, H) AAVrh.10hARSA groups. Black scale bars = 500 and 100 μm. H&E, hematoxylin and eosin.

