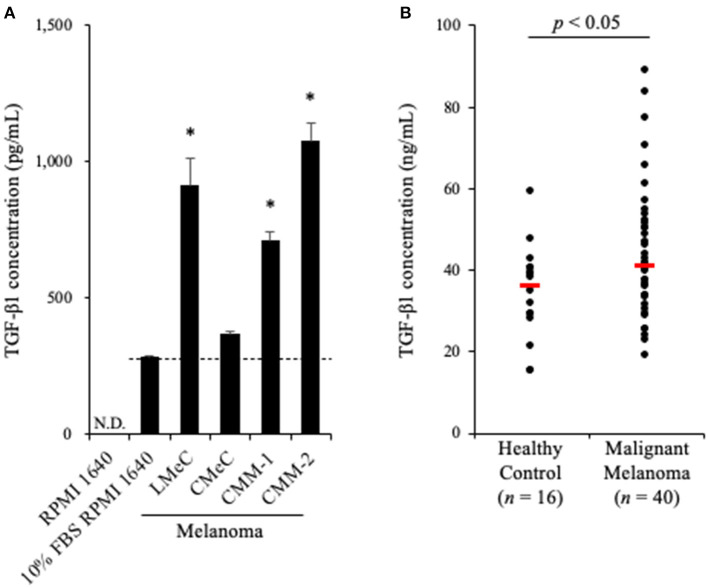
Figure 1.
TGF-β1 expression in canine cancers. (A) TGF-β1 production by canine cancer cell lines. TGF-β1 concentration in 10% FBS RPMI 1640 is shown as the background (a dashed line). One-way ANOVA with post-hoc Dunnett's-test was used for statistical analysis under the assumption of equal variance between samples (*p <0.05 vs. 10% FBS RPMI 1640). (B) TGF-β1 serum levels in dogs with oral malignant melanoma. The red bar shows the median value. The Mann-Whitney U-test was used for statistical analysis.

