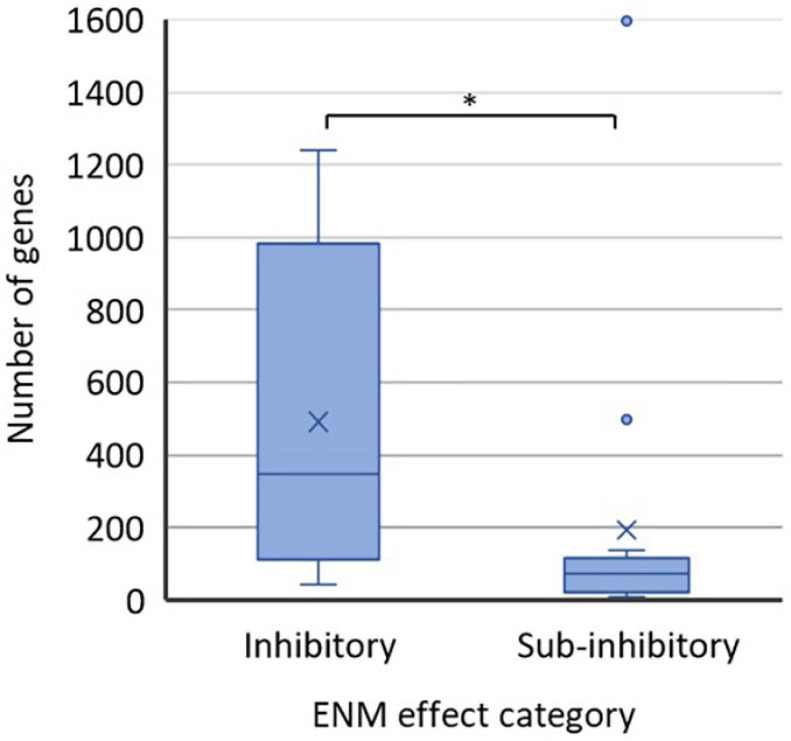
FIGURE 2.
Numbers of affected genes in ENM-exposed bacteria at physiological effect levels of ENMs which were either inhibitory (12 data points) or sub-inhibitory (15 data points) to bacteria. Values were extracted from the published literature consulted herein (Supplementary Table 2). The studies employed either RNAseq or microarray-based approach and mostly used the significance threshold of twofold change in the gene transcription (Supplementary Table 1). The bottom lines of the boxes represent the 1st quartile and the top lines of the boxes represent the 3rd quartile; the middle lines of the boxes are the median and the × are the mean values of the datasets. The whiskers show the minimum and maximum values; the data points outside the range of whiskers are considered outliers. ∗p < 0.05, t-test.

