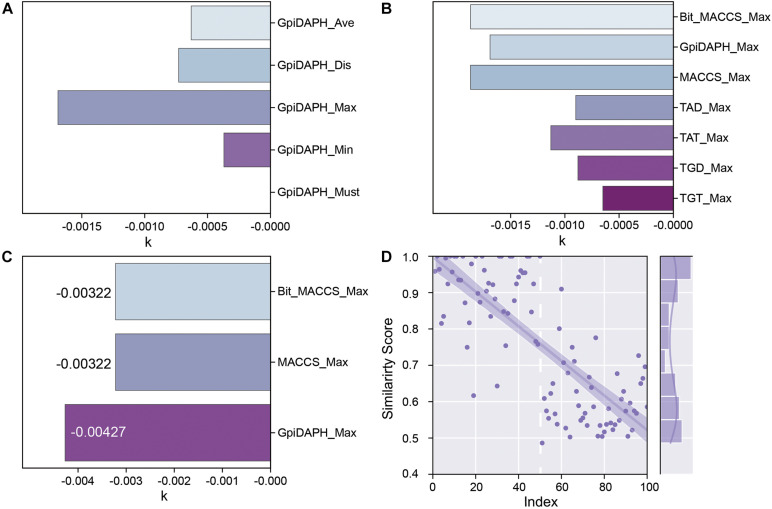
FIGURE 6.
(A) The k values of the fingerprint model when using different score functions. (B) The k values of each type of fingerprint model when using the Maximum scoring function. (C) The k values of Bit_MACCS, MACCS, and GpiDAPH on the new training set. (D) Similarity scores by GpiDAPH fingerprint model of active (index1-50) and inactive (index51-100) molecules.

