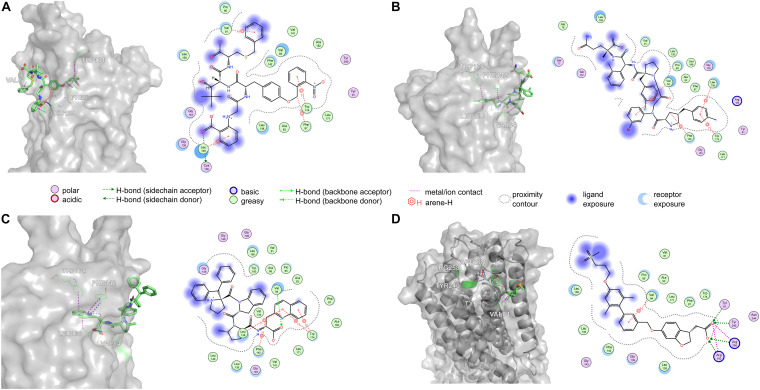
FIGURE 8.
The top three poses generated by flexible docking and the pose of TAK-875 in the crystal structure after energy minimization. In 3D pose diagrams, the red dash lines represent ionic bonds, magenta dash lines represent π–H interaction, and blue dash lines represent H-bonds. (A) 4-15, (B) 5-1, (C) 4-4, and (D) TAK-875.

