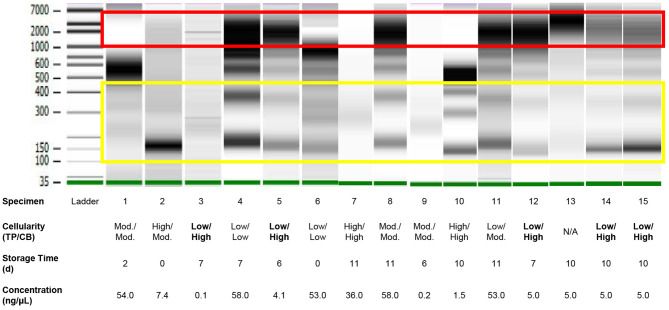
Figure 3.
Quality assessment of DNA of variable quantity extracted directly from residual effusion supernatant of variable cellularity and sampling time using gel electrophoresis performed on a 2100 Bioanalyzer (Agilent). High molecular weight DNA (red box) represents cellular/genomic DNA, while low molecular DNA in a ladder pattern in integer multiples of approximately 166 base pairs presumably represents cell-free DNA (yellow box). Intervening bands likely represent a mix of cellular/genomic and cell-free DNA. Cellularities highlighted in bold are those for which estimations—Low, Moderate (“Mod.”), or High—based on review of ThinPrep® slides were discordant from those based on review of cell block sections. Specimen numbers match those in Table 3.

