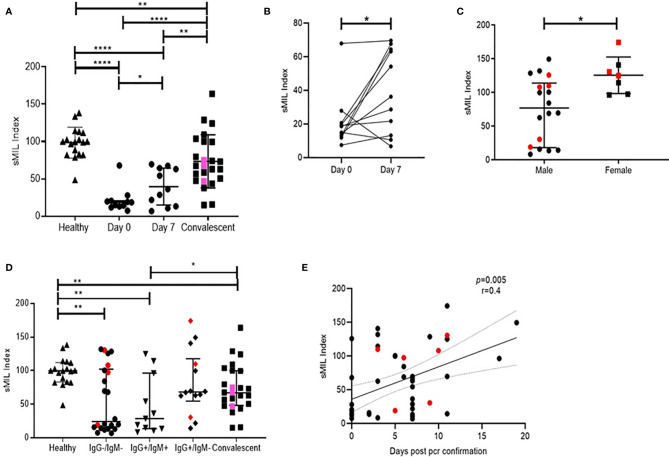
Figure 3.
Distribution of peak RU across various groups of study participants. Also the resolution of figures are satisfactory (A) Variation in sMIL index at day 0 (n = 11), day 7 (n = 11), in convalescent (n = 22), and in healthy (n = 16) groups. Pink colored symbols indicate IgG−/IgM− individuals in convalescent group.(B) Change in sMIL index between day 0 (n = 11) and day 7 (n = 11) expressed per individual.(C) Differences in sMIL index between male (n = 18) and female (n = 7). (D) Comparison of sMIL index between healthy (n = 16), IgG−/IgM− (n = 22), IgG+/IgM+ (n = 11), IgG+/IgM− (n = 14), and convalescent (n = 22) groups. (E) Association of sMIL index with days since SARS-CoV-2 confirmation by PCR (n = 47). Red colored symbols represent asymptomatic individuals. Statistical analysis was performed using Graphpad Prism 8.0. Wilcoxon matched-pairs signed rank test was used to compare paired samples of day 0 and day 7. Mann–Whitney U-test was used to compare unpaired groups. *p < 0.05, **p < 0.01 and ****p < 0.001. Correlation analysis was performed using non-parametric Spearman rank correlation test.

