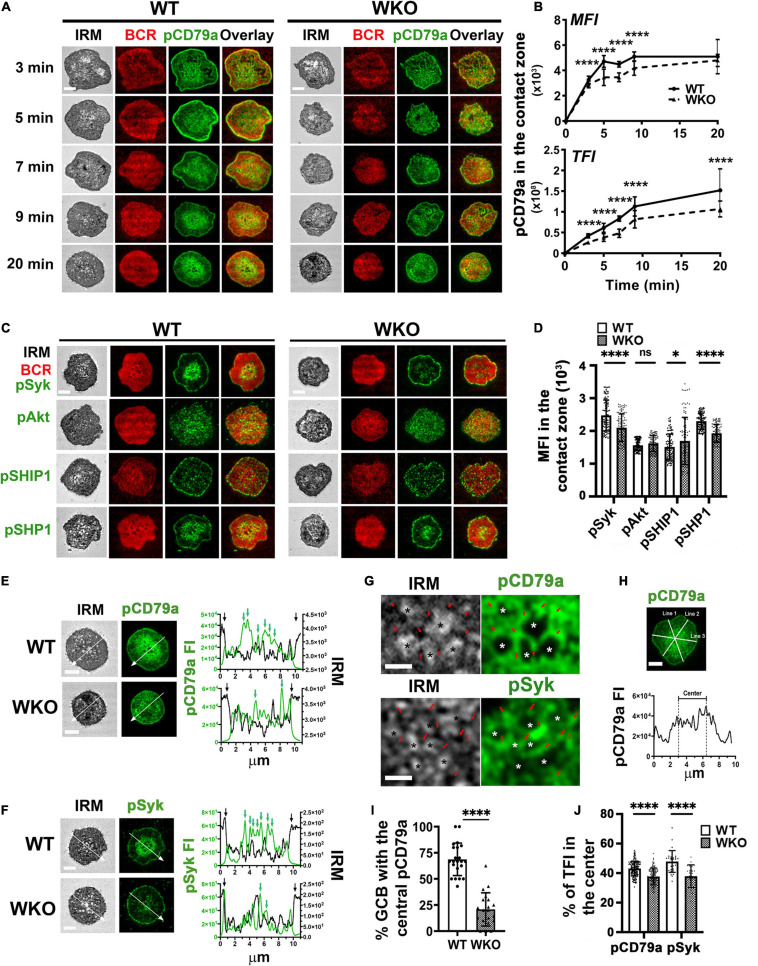
FIGURE 1.
WASp knockout (WKO) reduces BCR signaling and distorts the immunological synapse (IS) of light-zone germinal center B-cells (LZ GCBs). GCBs isolated from sheep red blood cells (SRBC)-immunized wild type (WT) and WKO mice were incubated with Alexa Fluor (AF) 546-conjugated monobiotinylated Fab’-anti-mouse IgM + G tethered planar lipid bilayers (Fab’-PLB) at 37°C and fixed at different times, permeabilized, stained for phosphorylated CD79a (pCD79a), Syk (pSyk), Akt (pAkt), SHIP1 (pSHIP1), or SHP1 (pSHP1). The GCB plasma membrane contacting Fab’-PLB (contact zone) was imaged by an interference reflection microscope (IRM) and a total internal reflection fluorescence microscope (TIRF). (A) Representative IRM and TIRF images of WT and WKO GCBs stained for pCD79a at 3, 5, 7, 9, and 20 min. (B) The mean fluorescence intensity (MFI) and the total fluorescence intensity (TFI) of the pCD79a in the contact zone at different times were quantified by NIH ImageJ. The results were the average (± SD) of > 60 individual cells per condition from six independent experiments. (C) Representative IRM and TIRF images of WT and WKO GCBs stained for pSyk, pAkt, pSHIP1, or pSHP1 at 7 min. (D) The MFI of pSyk, pAkt, pSHIP1, and pSHP1 in the contact zone at 7 min was measured using NIH ImageJ. Data points represent individual cells. (E,F) Representative IRM and TIRF images of WT and WKO stained for pCD79a (E) and pSyk (F) at 20 min and the FI and the IRM density along the lines. In the line profiles, black arrows indicate the outer edge of the contact zone. Green arrows indicate pCD79a or pSyk FI peaks. (G) Enlarged representative IRM and TIRF images of the central regions in the WT GCBs stained for pCD79a and pSyk shown in (E,F). Stars, plasma membrane areas that pulled away from Fab’-PLB. Red arrows, plasma membrane areas that were in close contact with Fab’-PLB. (H) GCBs with centralized pCD79a staining in the contact zone were identified using three randomly selected FI line profiles per cell. (I) Percentages of GCBs with the centralized pCD79a staining. Data points represent individual images at 5 min. (J) The percentages of pCD79a FI and pSyk FI in the central region indicated in (H). Data points represent individual cells. Scale bars, 3 μm. The results were the average (± SD) of > 60 individual cells per condition. n = 3∼4. *p < 0.05 and ****p < 0.0001, unpaired Student’s t-test or one-way ANOVA.

