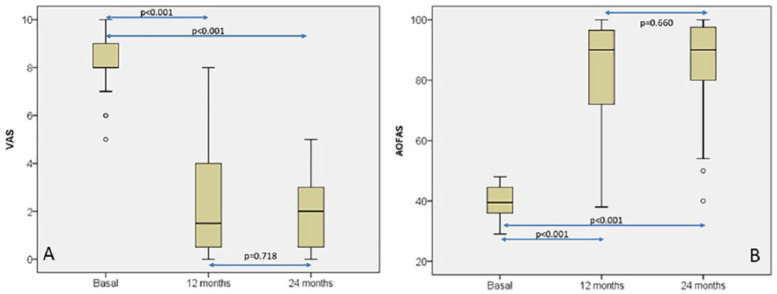
Figure 3.
Box plot representations of visual analogue scale (VAS) (A) and American Orthopaedic Foot & Ankle Society (AOFAS) ankle-hindfoot score (B) distributions at baseline, 12-month, and 24-month follow-up. Friedman’s 2-dimensional analysis of variance for related samples was used for statistical comparisons. Pairwise comparisons were carried out with Wilcoxon signed-rank test.

