
Figure 6.
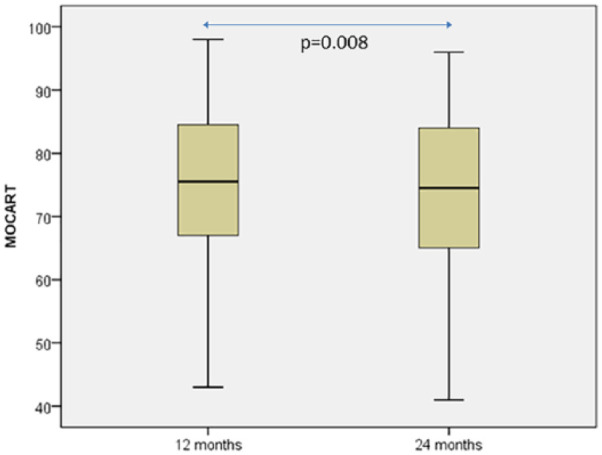
Box plot representation of magnetic resonance observation of cartilage repair tissue (MOCART) distribution at 12- and 24- month follow-up. Statistical comparison was carried out with the Student t test for related samples.
Official websites use .gov
A
.gov website belongs to an official
government organization in the United States.
Secure .gov websites use HTTPS
A lock (
) or https:// means you've safely
connected to the .gov website. Share sensitive
information only on official, secure websites.
Box plot representation of magnetic resonance observation of cartilage repair tissue (MOCART) distribution at 12- and 24- month follow-up. Statistical comparison was carried out with the Student t test for related samples.