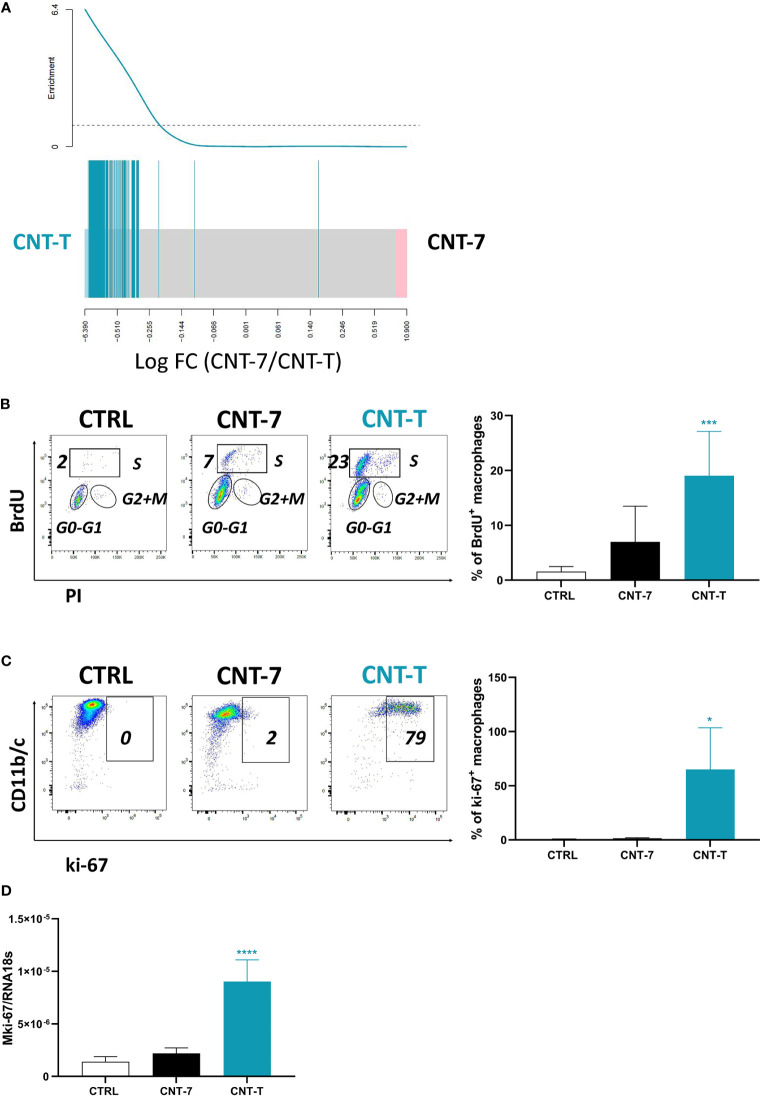
Figure 5.
Macrophages repopulating the peritoneal cavity after non-mesotheliomagenic CNT-T treatment are self-renewing. (A) Barcode plot showing enrichment of cell cycle related signature belonging to the “Cell Cycle/Mitotic” pathway R-RNO-69278 from Reactome database in the CNT-7 vs CNT-T macrophage comparison (respectively in black and green). Macrophages were purified from the rat peritoneal cavity after CNT-7 or CNT-T treatment (2 mg I.P.) at day 15. The worms show relative enrichment. (B) Flow cytometry dot plots show the proportions of peritoneal macrophages in S phase (BrdU-positive) of untreated Wistar rats or rats injected (2 mg I.P.) with CNT-7 or CNT-T and sacrificed at 7 days. Graph of BrdU-positive macrophages: each bar represents mean ± SD of 6 observations. (C) Flow cytometry dot plots show the proportions of peritoneal macrophages ki-67-positive from untreated or CNT-7/CNT-T treated rats sacrificed at 7 days. The graph represents the ki-67-positive macrophages from untreated rats and CNT-7 or CNT-T-treated rats. Each bar represents mean ± SD of 6 observations. (D) mki-67 from macrophages purified from untreated and CNT-treated rats (at 15 days) was quantified by qRT-PCR. Values are means ± SD of 4 animals. The results were statistically analysed using ANOVA test followed by Dunnett’s test. (*) p = 0.0332, (***) p = 0.0002, (****) p < 0.0001 indicates a statistically significant difference with controls.

