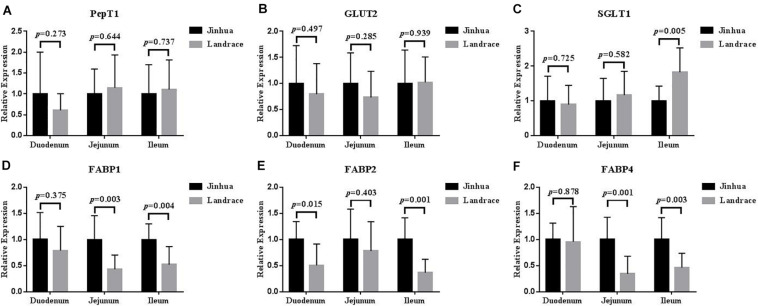
FIGURE 5.
Relative expression levels of PepT1, GLUT2, SGLT1, FABP1, FABP2, and FABP4 in the duodenum, jejunum, and ileum. The segments of duodenum, Jejunum, and ileum were collected from 10 Jinhua pigs and 10 Landrace pigs to examine the expression levels of PepT1 (A), GLUT2 (B), SGLT1 (C), FABP1 (D), FABP2 (E), and FABP4 (F) by using RT-PCR analysis. GAPDH was used as the reference gene. Data were expressed as mean ± SEM. The statistics was performed using unpaired Students’ two-tailed t-test.

