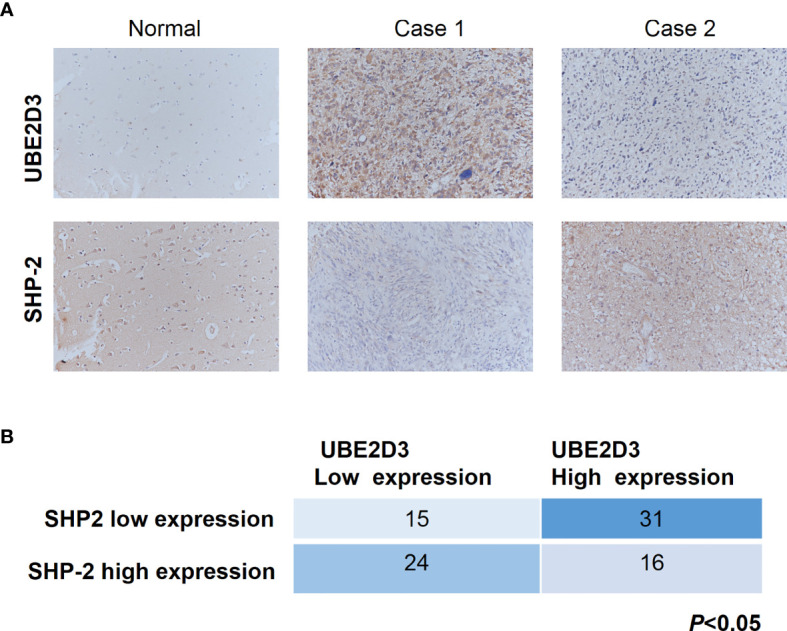
Figure 7.

UBE2D3 and SHP-2 exhibited reversed expression pattern in glioma specimens. (A) Immunohistochemistry staining of UBE2D3 and SHP-2 in representative glioma specimens. Case 1 represented UBE2D3 high but SHP-2 low specimens; Case 2 represented UBE2D3 low but SHP-2 high specimens. (B) Statistical analysis of the expression of UBE2D3 and SHP-2 in each glioma specimen (Fisher’s exact test).
