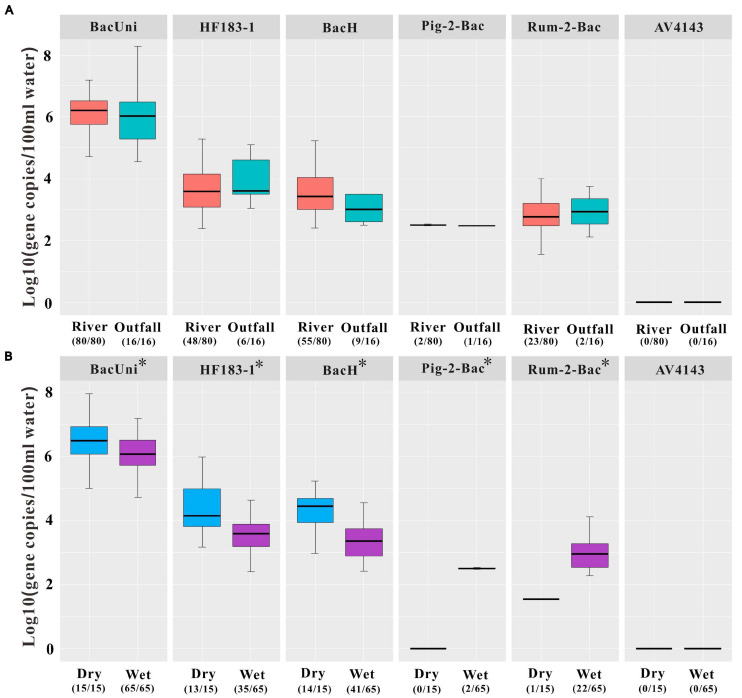
FIGURE 3.
Concentrations of the universal marker BacUni, the human-associated markers HF183-1 and BacH, the swine-associated marker Pig-2-Bac, the ruminant-associated marker Rum-2-Bac, and the avian-associated marker AV4143 in environmental samples, including (A) all river water and outfall water samples and (B) river water samples during the dry and wet seasons. Asterisk indicates that statistically significant differences were observed in the concentrations of the markers in the river water samples between the dry and wet seasons by independent-samples t-test at the 0.05 level of significance. Numbers in parentheses represent the sample number within the limit of detection (LOD)/total samples number tested. Each box plot shows the median, upper, and lower quartiles spanning the maximum and minimum observations. Log-transformed gene copies of negative results were treated as 0 value. Only positive results within the limit of quantification (LOQ) were displayed in the graph.

