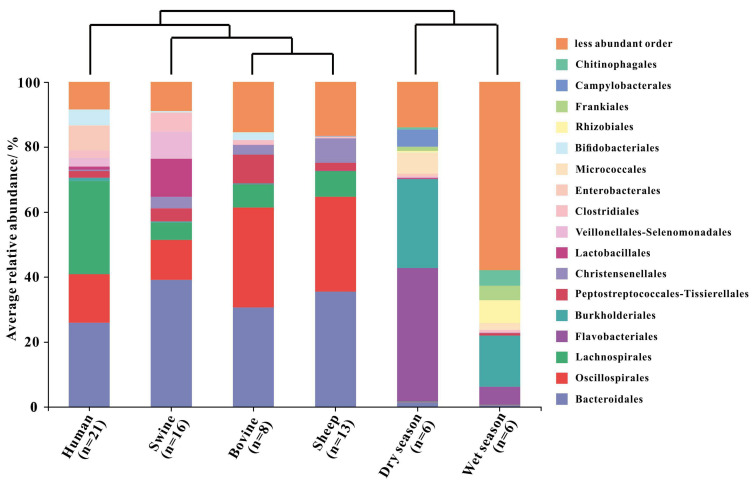
FIGURE 4.
Hierarchical clustering tree based on Bray–Curtis and the relative abundance of the bacterial community on the order level in the fecal samples (human, swine, bovine, and sheep) and river water samples collected from the dry and wet seasons. Only orders with a relative abundance higher than 4% were represented in the legend.

