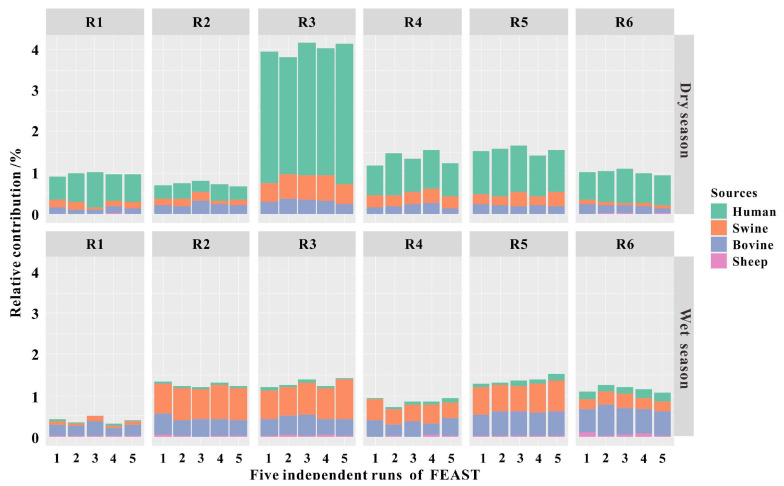
FIGURE 6.
Fast expectation–maximization microbial source tracking (FEAST) analyses showing the relative contributions of fecal pollution sources in river water collected from R1 to R6 during the dry and wet seasons. A single bar represents the relative contribution in an independent FEAST run using the same script. FEAST was run in five independent runs on the same script.

