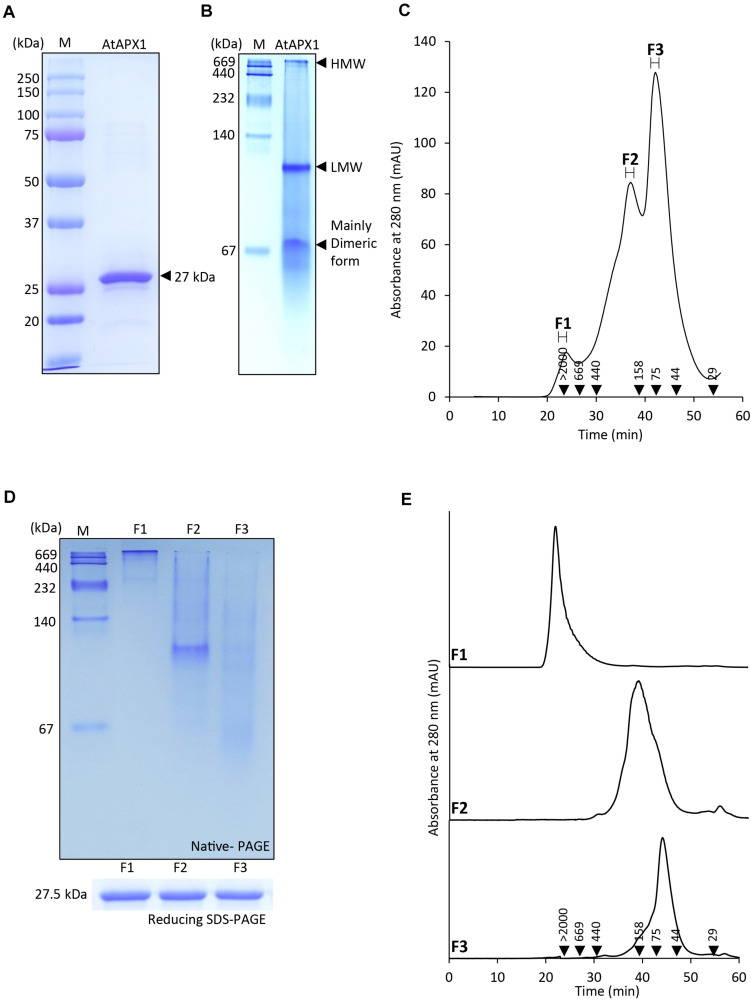
FIGURE 1.
Protein structure of AtAPX1 protein analyzed by (A) reducing SDS-PAGE, (B) native-PAGE, and (C,E) size exclusion chromatography (SEC). The values in the chromatogram represent the molecular weights of the standard proteins: blue dextran (>2,000 kDa), thyroglobulin (669 kDa), ferritin (440 kDa), aldolase (158 kDa), conalbumin (75 kDa), ovalbumin (44 kDa), and carbonic anhydrase (29 kDa). The three peaks (F1-F3) of separated proteins were collected and used for further analysis. (D) The fractions were separated by 10% native-PAGE and 12% reducing SDS-PAGE. (E) Each of the fractions was rechromatographed by SEC to confirm their stability.

