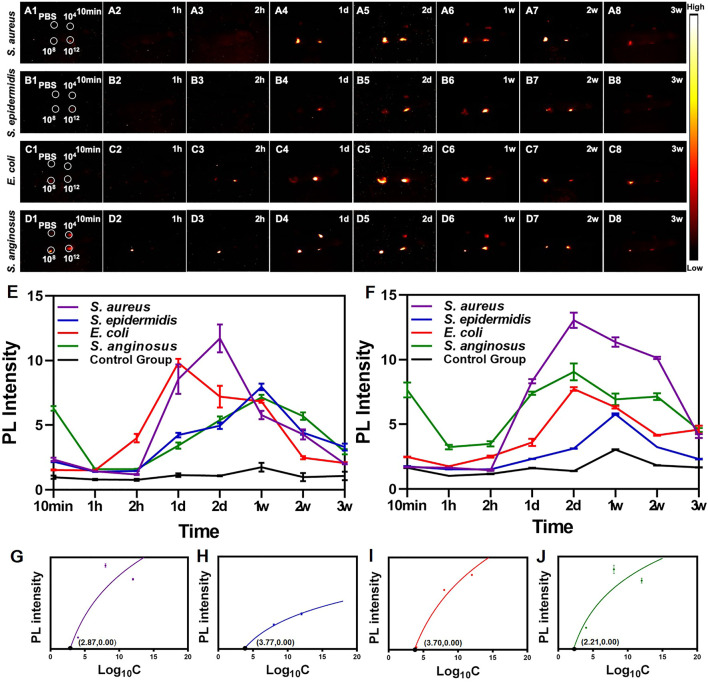
FIGURE 3.
(A–D) NIR-II images of nude mice at 10 min, 1 h, 2 h, 1 day, 2 days, 1 weeks, 2 weeks and 3 weeks post-infection. (E) PL intensity of the site injected with 1012 CFU/ml of bacteria. (F) PL intensity of the site injected with 108 CFU/ml of bacteria. Graphs depicting the relevance between PL intensity and different concentration of four strains of bacteria including (G) S. aureus, (H) S. epidermidis, (I) S. anginosus and (J) E. coli.

