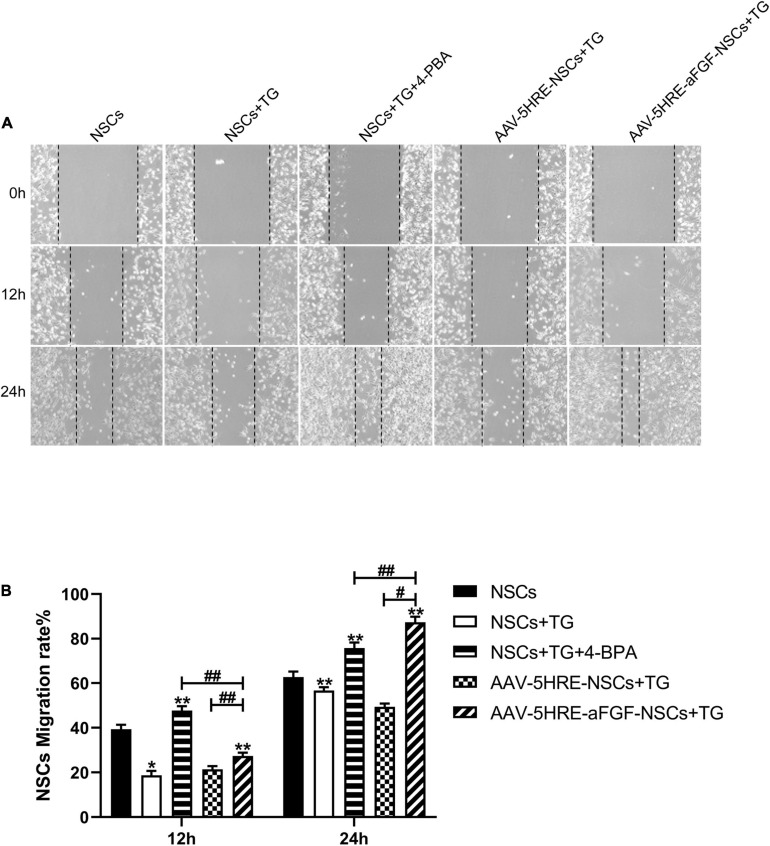
FIGURE 6.
AAV–5HRE–aFGF–NSCs promote NSC migration by inhibiting endoplasmic reticulum (ER) stress. (A) Cell migrating images in control, TG, TG+ 4–PBA, TG+ 4–BPA, AAV–5HRE–NSCs, and AAV–5HRE–aFGF–NSCs group. These images are 0-, 12-, and 24-h inspection images taken by an inverted phase-contrast microscope. (B) The NSCs migration rate for 12 and 24 h. #, *P < 0.05. ##, **P < 0.01. The data were processed by ImageJ and presented as the mean values ± SD, n = 6. TG, thapsigargin; PBA, phenylbutyric acid.

