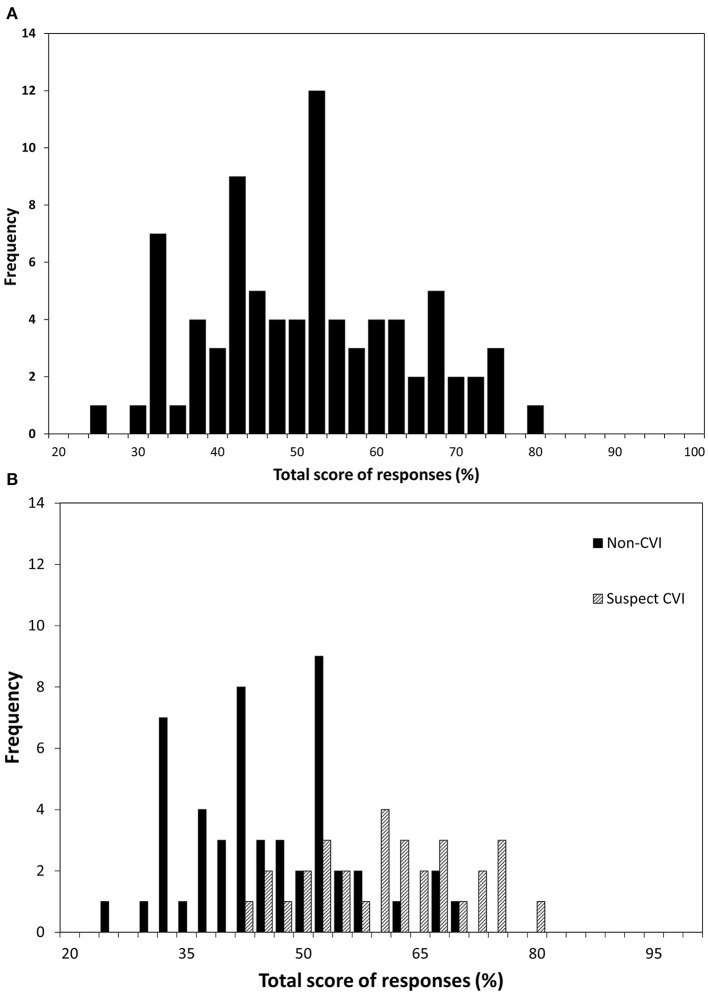
Figure 1.
The frequency distribution of the total raw scores in 81 children. The x-axis shows total score expressed as a percentage of applicable questions for (A) all children and (B) children divided into “suspected CVI” and “non-CVI” according to whether the child screened positive on the five-question CVI screening tool.

