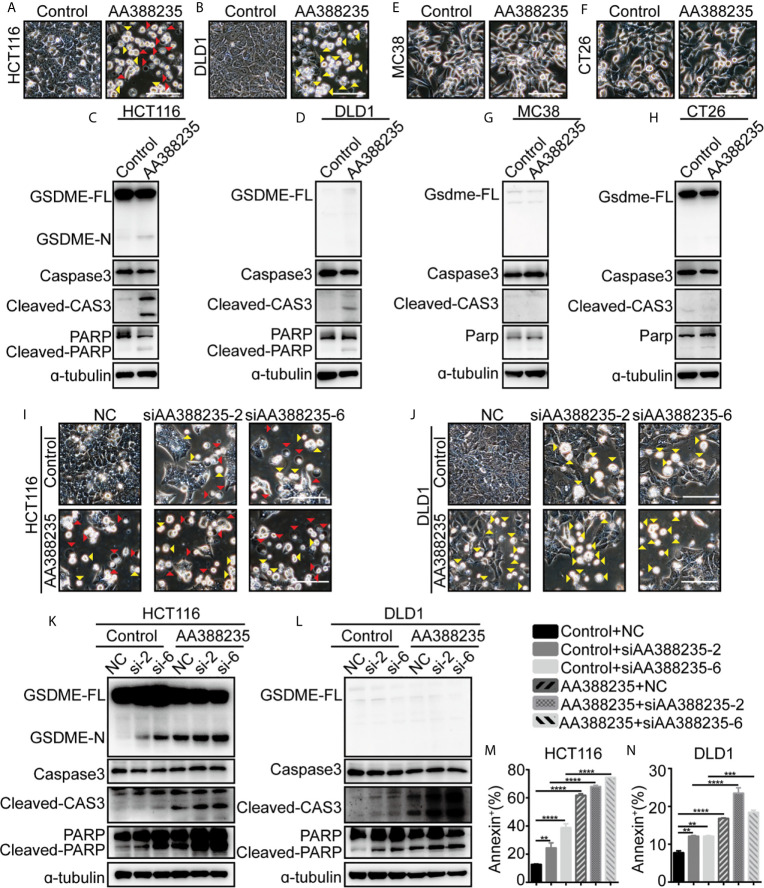
Figure 7.
IncRNA AA388235 induces pyroptosis or apoptosis of human tumor cells rather than mouse tumor cells. (A, B) Microscopic images of HCT116 and DLD1 cells transfected with plasmids as indicated. Red arrowheads indicated the pyroptotic cells, and yellow arrowheads indicated the apoptosis cells. Scale bar, 100 μm. (C, D) Immunoblotting assay of HCT116 and DLD1 cells transfected with plasmids as indicated. GSDME-FL, full-length of GSDME; GSDME-N, the N-terminal cleavage of GSDME; cleaved-CAS3, the cleavage of caspase-3 p19/p17; cleaved-PARP, the cleavage of PARP (E, F) Microscopic images of MC38 and CT26 cells transfected with plasmids as indicated. Scale bar, 100 μm. (G, H) Immunoblotting assay of MC38 and CT26 cells transfected with plasmid as indicated. Gsdme-FL, full-length of Gsdme; Cleaved-CAS3, the cleavage of caspase-3 p19/p17. (I, J) Microscopic images of HCT116 and DLD1 cells co-transfected with control or AA388235 plasmids and siRNAs as indicated. Red arrowheads indicated the pyroptotic cells, and yellow arrowheads indicated the apoptosis cells. Scale bar, 100 μm. (K, L) Immunoblotting assay of HCT116 and DLD1 cells co-transfected with control or AA388235 plasmid and siRNA as indicated. si-2, siAA388235-2; si-6, siAA388235-6. GSDME-FL, full-length of GSDME; GSDME-N, the N-terminal cleavage of GSDME; Cleaved-CAS3, the cleavage of caspase-3 p19/p17; cleaved-PARP, the cleavage of PARP. (M, N) Flow cytometry of PI (propidium iodide) and Annexin V-fluorescein isothiocyanate (FITC)-stained cells. The percentage of Annexin+ cells is the sum of PI+/Annexin V+ and PI-/Annexin V+ cells. P value was calculated by one-way ANOVA. Mean ± SEM, **P < 0.01, ***P < 0.001, ****P < 0.0001.

