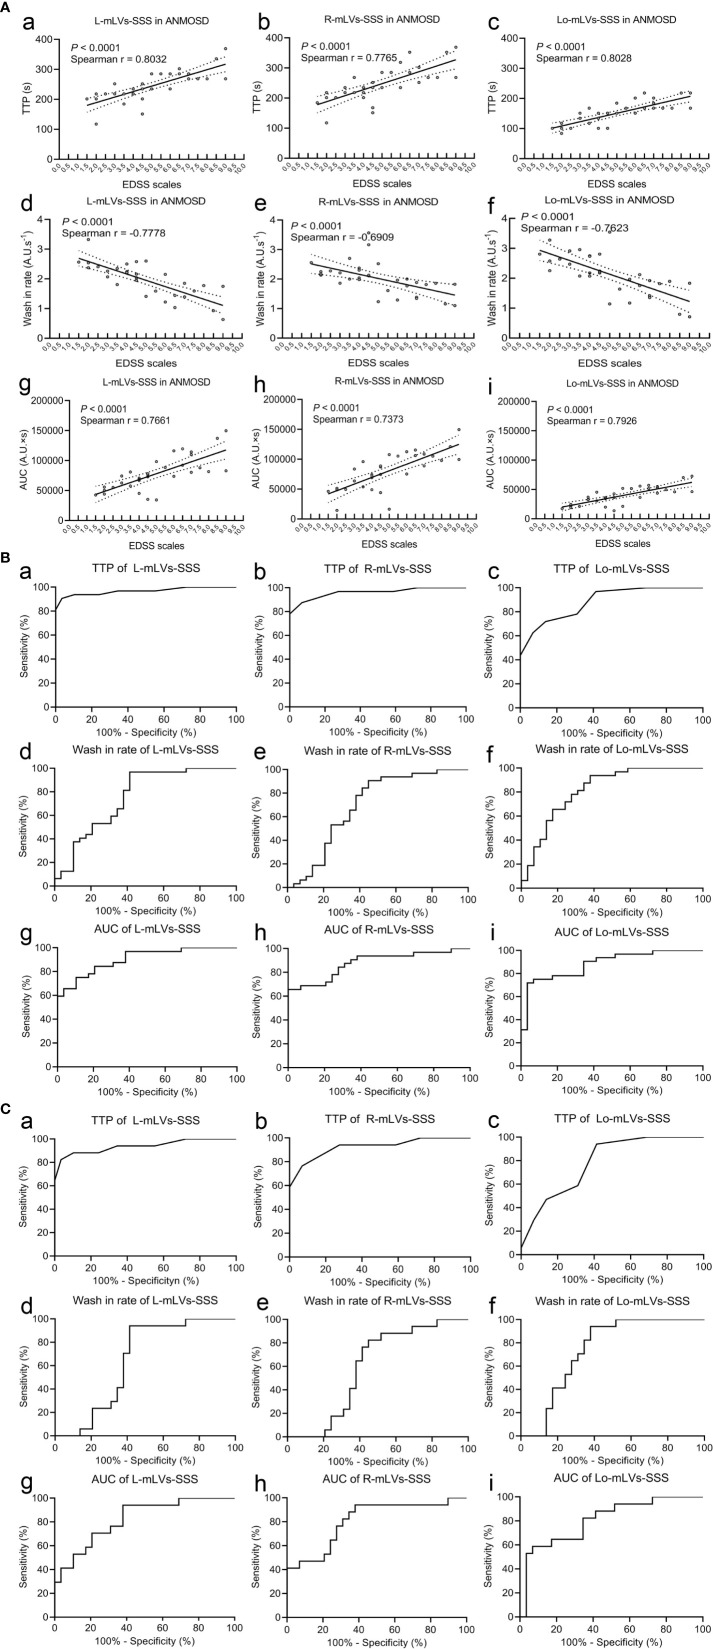
Figure 2.
Correlation between EDSS scales and DCE-MRI parameters, and the diagnostic accuracy of DCE-MRI parameters. (A) Correlations between the EDSS stage and the TTP (a–c), wash-in rate (d–f), and AUC (g–i) of mLVs-SSS in ANMOSD patients. The parameters were correlated with the EDSS stage. (B) Receiver operating characteristic (ROC) curve of the TTP (a–c), wash-in rate (d–f), and AUC (g–i) of mLVs-SSS in distinguishing ANMOSD from CNMOSD group. (C) ROC of the TTP (a–c), wash-in rate (d–f), and AUC (g–i) of mLVs-SSS in distinguishing I-ANMOSD group from CNMOSD group.

