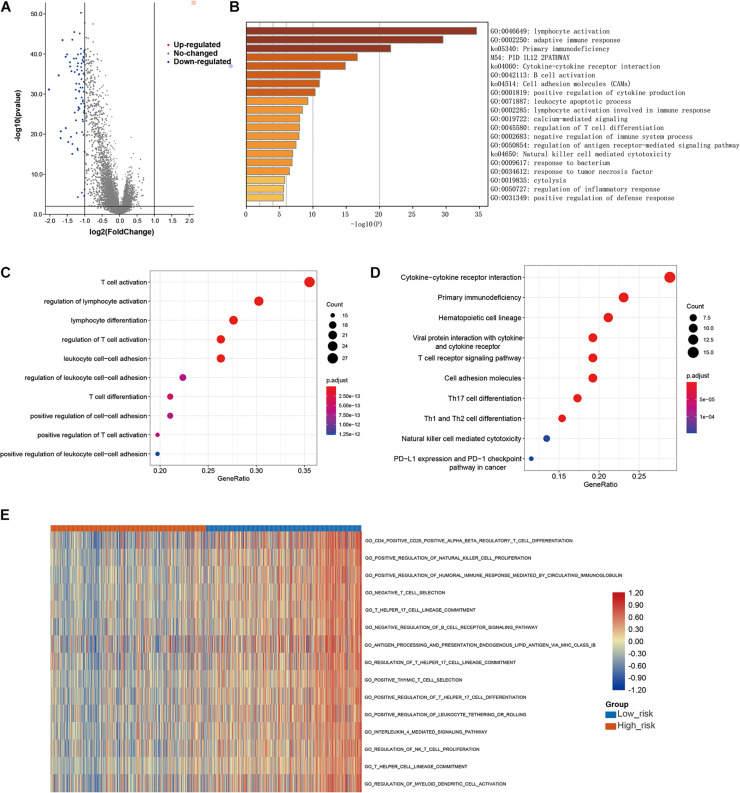
FIGURE 9.
Functional analyses. (A) Volcano plot depicting the differentially expressed genes (DEGs) between the two groups, (B,C) bubble plot derived from gene ontology (GO) analysis suggesting that the DEGs were mainly enriched in immune-associated biological processes, (D) bubble diagram derived from Kyoto Encyclopedia of Genes and Genomes (KEGG) analysis showing that the DEGs were enriched in immune-associated signaling pathways, (E) GSVA plots visualizing the result of GSVA analysis.

