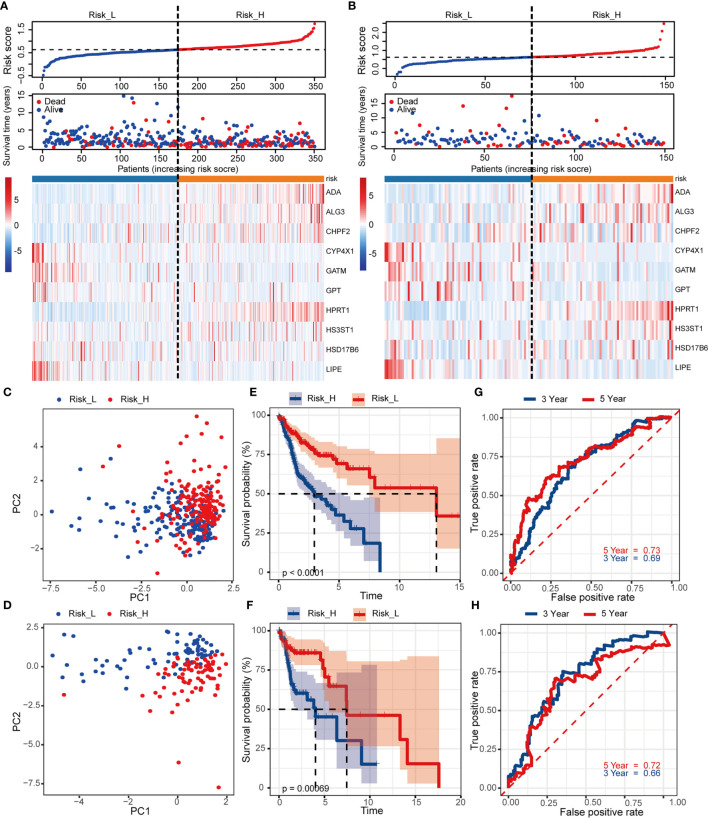
Figure 3.
Construction and internal validation of the prognosis-related risk model based on MRGs in TCGA cohort. The risk scores distribution, vital status of patients, and heatmap of identified 10 MRGs expression level in (A) training and (B) validation cohorts. (C, D) PCA plot of prognostic metabolism signature. (E, F) Kaplan-Meier curves of OS and (G, H) time-dependent ROC analysis for 3/5-year survival to predict OS.

