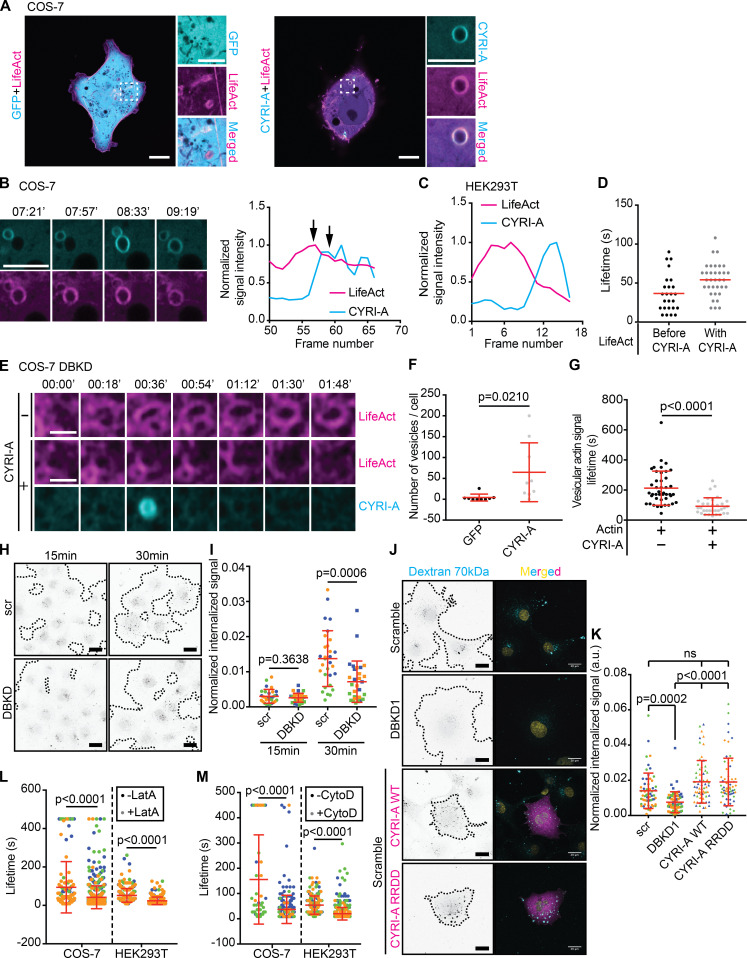
Figure 5.
CYRI-A regulates actin dynamics at macropinocytic structures. (See Video 4, Video 5, and Video 6.) (A) Still images of COS-7 cells coexpressing either GFP (negative control) or P16-GFP-CYRI-A (cyan) and LifeAct-RFP (magenta). Scale bar = 10 µm for full-sized image and 5 µm for zooms. (B) Time sequence images showing the dynamics of P16-GFP-CYRI-A and actin at the macropinocytic structure in COS-7 cells. Graph shows normalized signal intensities over time. Black arrows denote peak actin and CYRI-A signals. Scale bar = 5 µm. (C) Normalized signal intensities over time between P16-GFP-CYRI-A and LifeAct signal in HEK293T cells. (D) Lifetime of actin before and after P16-GFP-CYRI-A is recruited in HEK293T cells (before CYRI-A, n = 25 events in 10 cells; with CYRI-A, n = 34 events in 10 cells). Red lines indicate the average value. (E–G) Lifetime of actin on macropinocytic structures ± expression of P16-GFP-CYRI-A in CYRI DBKD COS-7 cells. Scale bar = 1 µm. Number of actin-positive structures in cells ± P16-GFP-CYRI-A expression (n = 9 cells; F). Lifetime of the actin signal on macropinocytic structures ± P16-GFP-CYRI-A signal (actin alone, n = 43 events in 9 cells; actin with CYRI-A, n = 33 events in 8 cells). (H) Macropinocytosis assay in siRNA-treated COS-7 cells. Scr, scramble. Black dots are internalized dextran. Black dashed lines indicate the boundary of the cell clusters. Scale bar = 30 µm. (I) Macropinocytic index of H. Data are from at least 10 different fields of view per experiment from a total of three independent experiments (color-coded by experiment). Two-tailed unpaired t test. Mean ± SD. (J and K) Expression of P16-mCherry-CYRI-A in control COS-7 cells, DBKD COS-7 cells, and P16-mCherry-CYRI-A RRDD mutant (non-RAC1 binding mutant) cells showing dextran 70-kD uptake capacity of the cells. Data are from ≥10 different fields of view for a total of three independent experiments. Each experiment is color-coded. Mean ± SD. Kruskal–Wallis test with Dunn’s multiple comparison test. ns, P > 0.05. (L and M) Lifetime of P16-GFP-CYRI-A on macropinosomes ± 1 µM of Latrunculin A (LatA) or Cytochalasin D (CytoD) in COS-7 and HEK293T cells. At least five cells per experiment from three independent experiments (color-coded). Mean ± SD. Mann–Whitney U test.

