Figure 6.
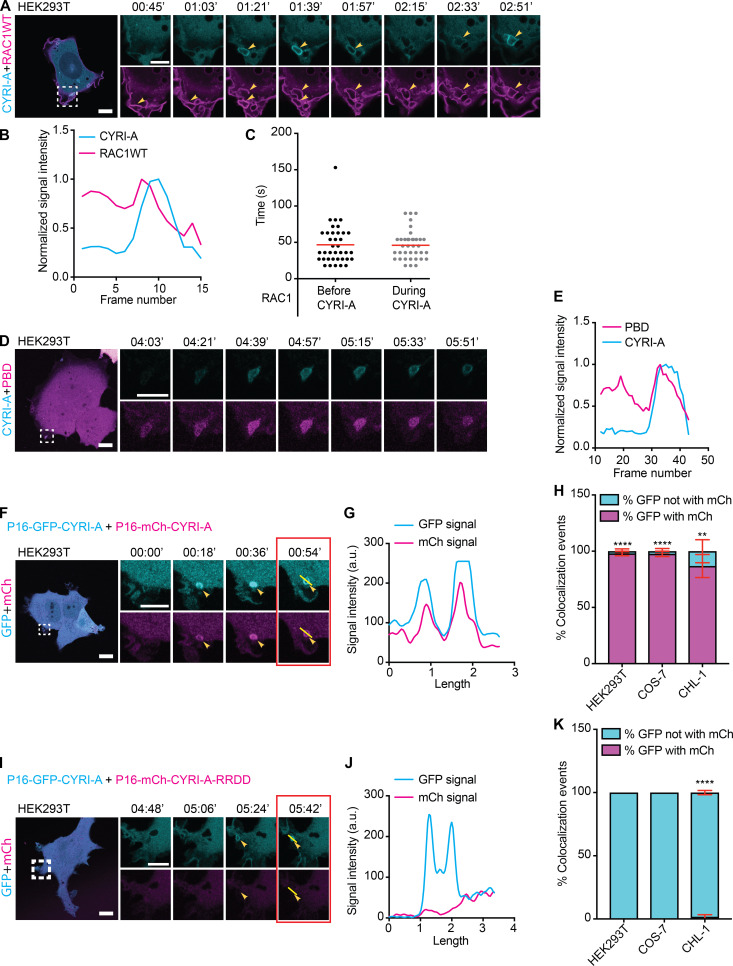
CYRI-A is recruited to macropinocytic structures by active RAC1. (See Video 7.) (A–C) Time sequence images of HEK293T cell coexpressing P16-mCherry-CYRI-A (cyan) and GFP-RAC1 WT (magenta). (B) Normalized signal intensity of RAC1 and CYRI-A at macropinocytic structure. (C) Lifetime of RAC1 signal on the macropinocytic structures (n = 37 events in 4 cells). Scale bar = 10 µm for full-sized image and 5 µm for zooms. (D and E) Time sequence images of HEK293T cell coexpressing P16-GFP-CYRI-A (cyan) and CFP-PBD (magenta). (E) Normalized signal intensities of CYRI-A and PBD over time. Scale bar = 10 µm for full-sized image and 5 µm for zooms. (F–K) Time sequence images of HEK293T cells coexpressing either WT or RRDD mutant of P16-mCherry-CYRI-A (magenta) with the WT P16-GFP-CYRI-A (cyan; F and I). Colocalization of the signals between the two WT constructs (G) and lack of colocalization between WT and mutant constructs (J). Percentage of colocalization events (n = 5 cells; H and K). Scale bar = 10 µm for full-sized image and 5 µm for zooms. Two-tailed unpaired t test. Mean ± SEM. **, P < 0.01; ****, P < 0.0001.

