Figure 7.
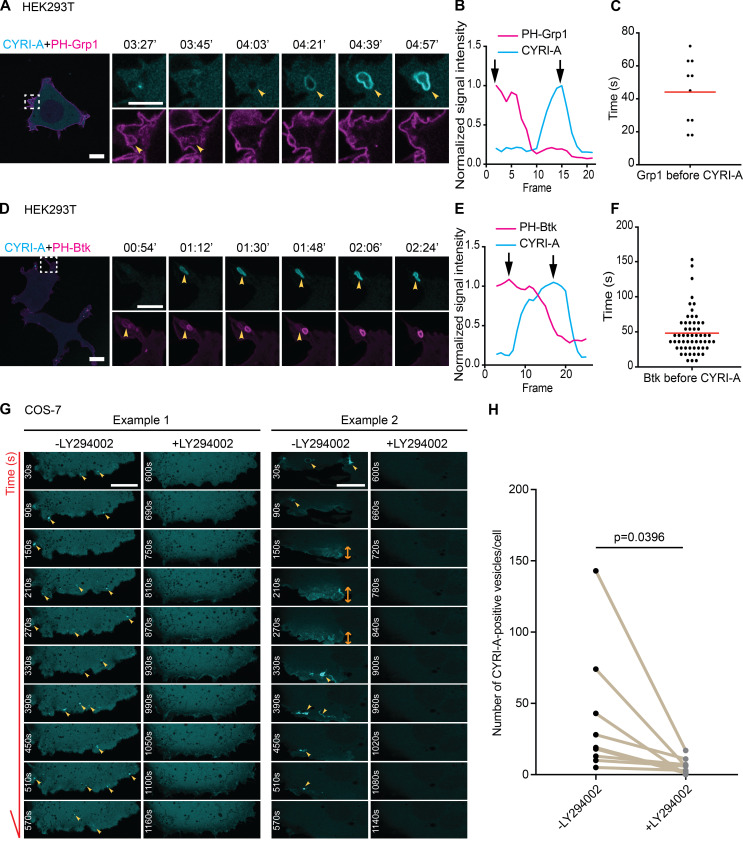
CYRI-A’s recruitment to macropinocytic structures is dependent on PI3K signaling. (See Video 8.) (A–F) HEK293T cells were cotransfected with P16-mCherry-CYRI-A (cyan) and either GFP-PH-Grp1 (magenta) or GFP-PH-Btk (magenta) as specific markers for PIP3 (A and D). Line graphs show the sequential events between PIP3 reporters and CYRI-A (B and E). Black arrows indicate the peaks of each normalized signal. Scatter plots show the average lifetime of PIP3 reporter signal before CYRI-A is recruited to macropinocytic structures (Grp1, n = 9 events in 3 cells; Btk1, n = 57 events in 6 cells). Red lines represent the average value. Scale bar = 10 µm for full-sized images and 5 µm for zooms. (G and H) Time sequence images showing COS-7 cells expressing P16-GFP-CYRI-A before and after the addition of 20 µM of LY294002. Quantification shows a significant decrease in the number of P16-GFP-CYRI-A–positive cups/vesicles formed upon PI3K inhibition (n = 9 cells). Scale bar = 10 µm. Statistical analysis using paired t test.

