Figure 9.
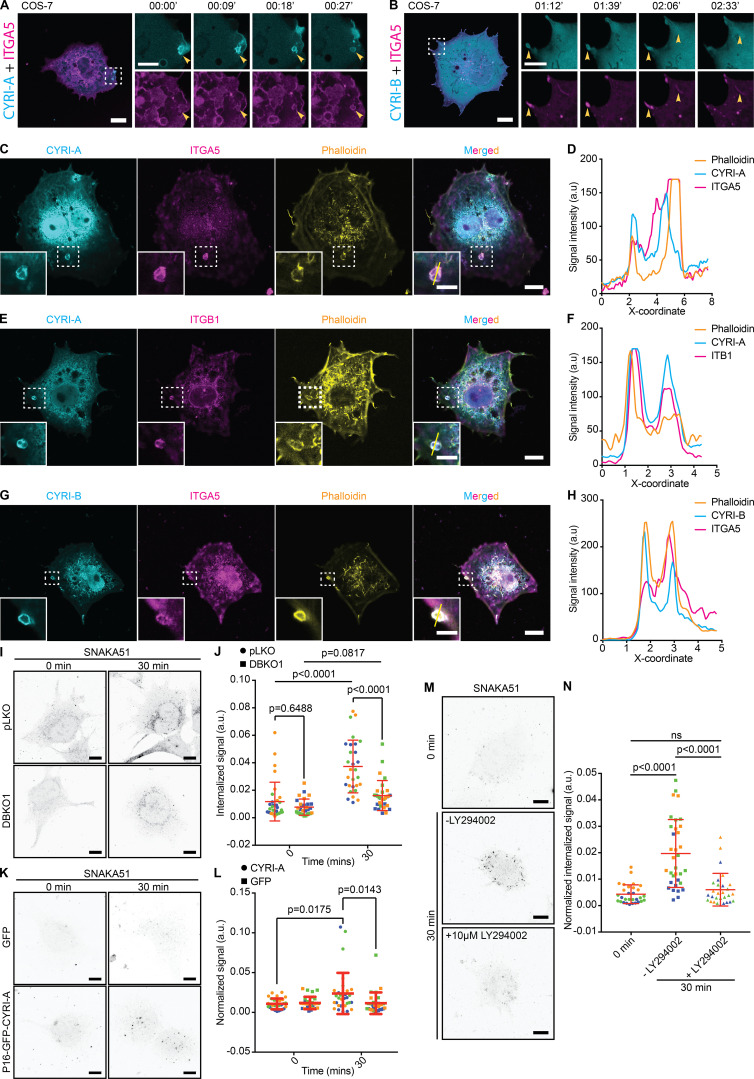
CYRI-A and CYRI-B cooperatively regulate the internalization of integrin α5β1. (See Video 9.) (A and B) Time sequence images of COS-7 cells coexpressing either P16-GFP-CYRI-A or P17-GFP-CYRI-B and mApple-tagged integrin α5. Scale bar = 10 µm for full-sized image and 5 µm for zooms. (C–H) Colocalization analysis of P16-GFP-CYRI-A or P17-GFP-CYRI-B (cyan) with endogenous integrin α5 or β1 (magenta) and actin (orange) in COS-7 cells. Right panels (D, F, and H) are intensity graphs showing the colocalization of all three normalized signals at the cups/vesicles. Scale bar = 10 µm for full-sized image and 5 µm for zooms. (I and J) Internalization assay of A-673 cells for active integrin α5 (SNAKA51, cyan) after 0- or 30-min incubation. (I) Representative images of the internalized signal of active integrin α5 (SNAKA51, black dots). (J) Quantification of the area of the internalized signals. Data from three independent experiments of at least 10 cells per experiment. Each experiment is color-coded. Statistical analysis using one-way ANOVA with Tukey’s multiple comparison test. Mean ± SD. Scale bar = 10 µm. (K and L) Reexpression of P16-GFP-CYRI-A in CYRI DBKO A-673 cells rescued the internalization defect in these cells compared to cells expressing only GFP. (L) Quantification of K. Data from three independent experiments of at least 10 cells per experiment. Each experiment is color-coded. Statistical analysis using one-way ANOVA with Tukey’s multiple comparison test. Mean ± SD. Scale bar = 10 µm. (M and N) CYRI DBKO A-673 reexpressing P16-GFP-CYRI-A treated with 10 µM LY294002 show reduction in the internalized active integrin α5 signal compared the untreated cells. (N) Quantification of at least 10 cells per experiment in a total of three independent experiments. Each experiment is color-coded. Statistical analysis using one-way ANOVA with Tukey’s multiple comparison test. Mean ± SD. Scale bar = 10 µm. ns, P > 0.05.

