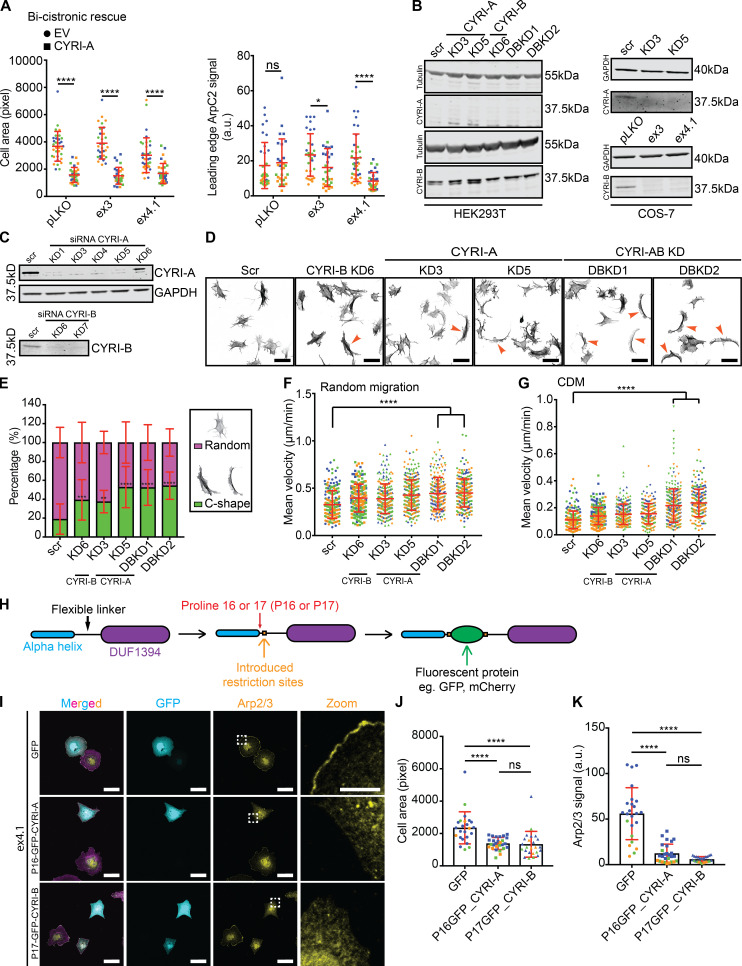
Figure S1.
CYRI-A and CYRI-B have complementary functions in cells. (A–G) pLKO, control CRISPR line; ex3 and ex4.1, CYRI-B CRISPR COS-7 cell lines; scr, scramble; KD3 and KD5, CYRI-A siRNA knockdowns; KD6, CYRI-B siRNA knockdown, DBKD, KD3 + KD6, or KD5 + KD6. (A) Quantification of cell area (left) and the average Arp2/3 signal intensity around the cell perimeter in CYRI CRISPR COS-7 cells (ex3 and ex4.1) rescued with untagged bi-cistronic CYRI-A. Data from three independent experiments; statistical analysis using unpaired t test. Each experiment is color-coded. Mean ± SD. *, P < 0.05; ****, P < 0.0001. (B) Western blot of control or KD of CYRI-A and CYRI-B in HEK293T cells (left) and COS-7 (right) showing that HEK293T cells express only CYRI-B while COS-7 cells express both isoforms. Tubulin and GAPDH are loading controls. (C) Western blot of endogenous CYRI-A and CYRI-B in control or KD A-673 cells. GAPDH is loading control. (D) Representative immunofluorescence images of control scrambled (scr), single CYRI-A or CYRI-B, and CYRI-A/B DBKD in A-673 cells stained for F-actin (phalloidin). Orange arrowheads point to C-shaped cells. Scale bar = 50 µm. (E) Quantification of the number of C-shaped cells in D. Data from three independent experiments with at least 50 cells per experiment. One-way ANOVA with Tukey’s multiple comparisons. Mean ± SD. **, P < 0.01; ***, P < 0.001; ****, P < 0.0001. (F and G) Quantification of the mean velocity of control, single KO, and CYRI-A/B DBKD A-673 cells plated on 2D fibronectin (F) or in 3D CDM (G). Data from at least 30 cells per experiment in a total of three independent experiments. Each experiment is color-coded. One-way ANOVA with Tukey’s multiple comparison test. Mean ± SD. ****, P < 0.0001. (H) Schematic representation of the cloning strategy used to create the internal fluorescent tag for CYRIs. (I) Immunofluorescence images of control or CYRI-B CRISPR COS-7 (ex4.1) transfected with either P16-GFP-CYRI-A or P17-GFP-CYRI-B (cyan) and stained for Apr2/3 (yellow) and F-actin (magenta). Scale bar = 20 µm for full-size image or 10 µm for zoom. (J and K) Quantification of the cell area and the average Arp2/3 signal at the cell periphery of CYRI-B CRISPR COS-7 cells (ex4.1) expressing either GFP control or the internal-GFP tagged CYRI constructs. Data from at least 20 random fields in a total of three independent experiments. Each experiment is color-coded. One-way ANOVA with Tukey’s multiple comparison test. ns = P > 0.05; * P < 0.05; ****, P < 0.0001.

