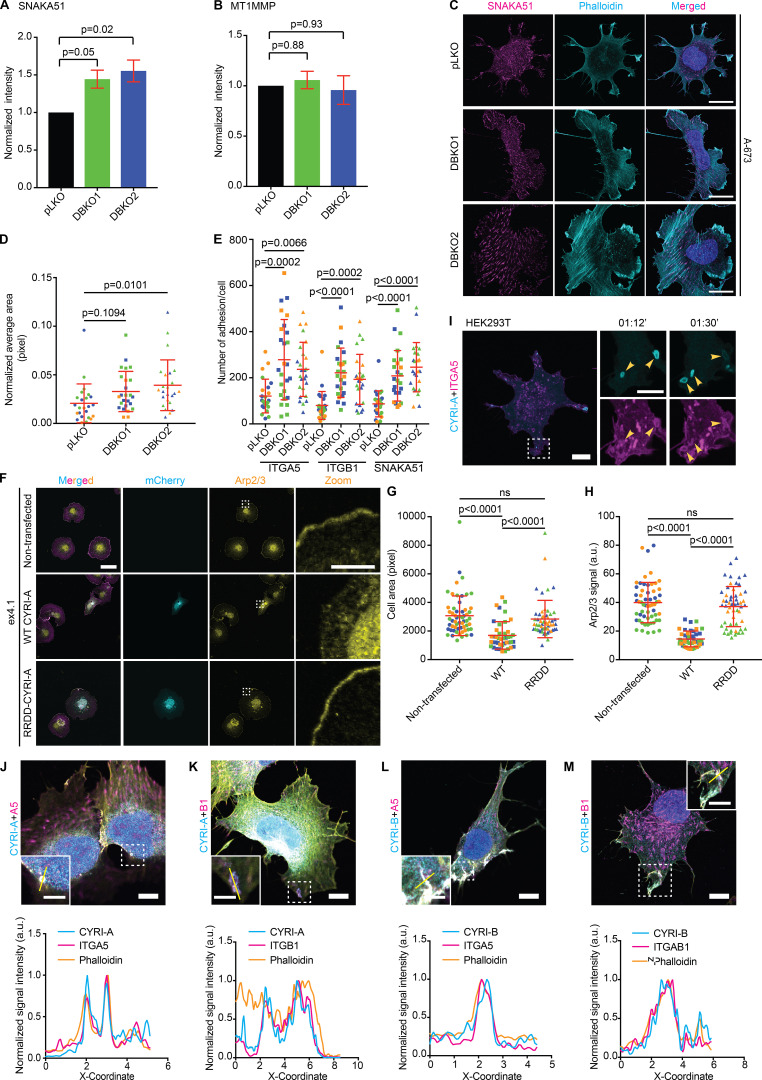
Figure S4.
CYRIs affect integrin α5β1 trafficking. (See Video 9.) (A and B) Flow cytometry analysis of surface expression of active integrin α5, detected using the SNAKA51 antibody (A) and MT1MMP (B) comparing the control pLKO and CYRI-A/B DBKO A-673 cells. Data from three independent experiments. Statistical analysis using one-way ANOVA with Tukey’s multiple comparison test. (C–E) Immunofluorescence images of the control pLKO and DBKO A-673 cells stained for active integrin α5 (magenta) and actin (cyan). The average area of integrin clusters or the number of clusters per cell are quantified in D and E. Data from three independent experiments with at least 10 cells per experiment. Each experiment is color-coded. Mean ± SD. Statistical analysis use one-way ANOVA with Tukey’s multiple comparison test. Scale bars = 20 µm. (F–H) Non-RAC1-binding mutant P16-mCherry-CYRI-A RRDD does not rescue the spreading phenotype of CYRI-B KO COS-7. Quantification of the cell spread area (G) and the Arp2/3 signal accumulating at the cell periphery (H) show that WT CYRI-A rescued these phenotypes in CYRI-B KO COS-7, while RRDD mutant did not. Data from at least 10 random fields of view in a total of three independent experiments. Each experiment is color-coded. Statistical analysis using one-way ANOVA with Tukey’s multiple comparison test. Mean ± SD. ns, P > 0.05. (I) Time sequence images of HEK293T cells coexpressing P16-GFP-CYRI-A (cyan) and mApple-integrin α5 (magenta) showing integrin α5 signal present on CYRI-A–positive vesicles. Scale bar = 10 µm for full-sized image and 5 µm for zooms. (J–M) Immunofluorescence images of endogenous integrins α5 and β1 in A-673 cells with the P16-GFP-CYRI-A or P17-GFP-CYRI-B constructs along with actin (yellow). Graphs show the colocalization of CYRI-A, integrins, and filamentous actin (phalloidin) on the vesicles. Scale bars = 10 µm. In C, F, and J–M: DAPI for DNA.

