Figure 4.
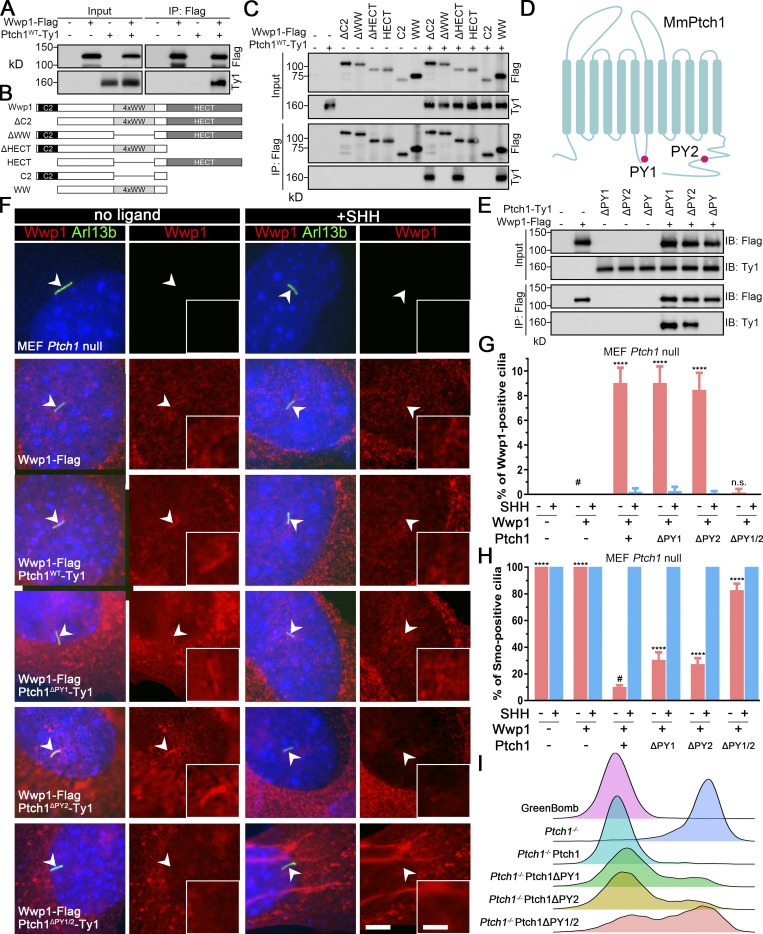
Wwp1 activity against Smo is regulated by controlling its ciliary localization through Ptch1 binding.(A) Immunoprecipitation of Ptch1 and Wwp1. HEK 293T cells expressing Ptch1-Ty1 and Wwp1-Flag were immunoprecipitated with anti-Flag resin and probed for Flag and Ty1. Input is equivalent to 10% of the precipitate. (B) Domain structure of Wwp1 and diagram of deletion constructs used for coimmunoprecipitation. (C) Constructs described in B were coexpressed with Ptch1-Ty1 in HEK 293T cells and precipitated (IP) with anti-Flag resin. Input is equivalent to 10% of input. Note that deletion of the 4xWW domain of Wwp1 prevents binding to Ptch1. (D) Schematic diagram of Ptch1 showing the PY motif locations. (E) Immunoprecipitation of Wwp1 and Ptch1 PY motif mutants. Ptch1-Ty1 constructs lacking the first PY (ΔPY1), the second PY (ΔPY2), or both PY motifs (ΔPY1/2) were coexpressed in HEK 293T cells with Wwp1-Flag and immunoprecipitated with anti-Flag resin. Note that the loss of both PY motifs prevents binding of Wwp1 to Ptch1, but Ptch1 retaining either PY motif is still able to bind Wwp1. IB, immunoblotting. (F) Immunofluorescence showing Wwp1 (Flag, red) in cilia (Arl13b, green, arrowheads) with or without SHH treatment in Ptch1−/− cells expressing the Ptch1 mutants. Nuclei were stained with DAPI (blue). Scale bar, 5 microns. Insets are 2.5× enlargements. The scale bar in the inset represents 2 microns. (G) Quantitation of Wwp1-positive cilia in MEF Ptch1-null cells expressing Ptch1 or Ptch1 mutants. n = 5 repeats with >110 cilia counted per experiment. ****, P < 0.0001 compared with MEF Ptch1-null cells expressing Wwp1 (−SHH, labeled with #) by two-way ANOVA. Error bars indicate SD. (H) Quantitation of Smo-positive cilia in MEF Ptch1-null cells expressing Ptch1 or Ptch1 mutants. n = 4 repeats with 200 cilia counted per experiment. Smo was detected with an antibody against the endogenous protein. ****, P < 0.0001 compared with unstimulated MEF Ptch1-null cells expressing Ptch1 and Wwp1 (−SHH, labeled with #) by two-way ANOVA. Error bars indicate SD. (I) Ridgeline plot of flow cytometry analysis of GreenBomb, GreenBomb Ptch1-knockout cells, and GreenBomb Ptch1-knockout cells rescued with Ptch1, Ptch1ΔPY1, Ptch1ΔPY2, or Ptch1ΔPY1/2. Traces are shown for unstimulated cells. Each trace represents fluorescence intensity of 10,000 individual cells.

